Figures & data
Figure 1 (A) Schematic illustration of synthetic procedure of HMPB NPs. The SEM images of (B) PB NPs, (C) MPB NPs, and (D) HMPB NPs. Scale bar 300 nm. The individual TEM images of (E) PB NPs, (F) MPB NPs, and (G) HMPB NPs. Scale bar 50 nm.
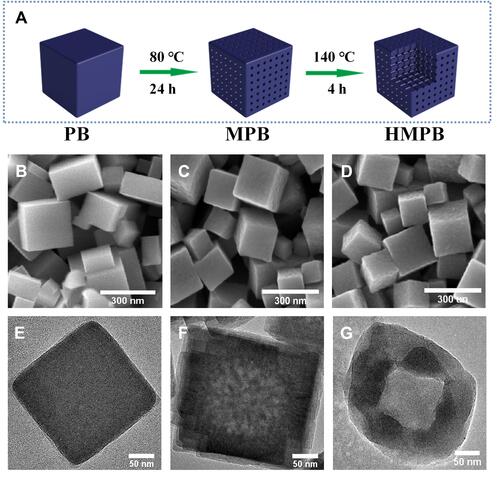
Figure 2 In vitro photothermal-conversion performance of different materials. The concentrations of PB NPs, MPB NPs and HMPB NPs were 100 μg mL−1. (A) UV-vis spectrum of PB NPs (purple), MPB NPs (red), and HMPB NPs (blue) at 808 nm. (B) Temperature-rise curves of PB NPs (purple), MPB NPs (red), and HMPB NPs (blue) within 10 min under irradiation of 808 nm NIR laser (1.5 W cm−2). (C) Recycling heating curves of the solution containing HMPB NPs for five on/off cycles of the 808 nm NIR laser irradiation (1 W cm−2). (D) Calculated photothermal-conversion efficiency of HMPB NPs at 808 nm. Red line: temperature change curves of the solution under 808 nm NIR laser irradiation for 10 min. Black line: cooling curve with NIR laser turned off. Blue line: time constant (τs=322.05) for the heat transfer from the system obtained by applying the linear time data from the cooling period (R2=0.99869).
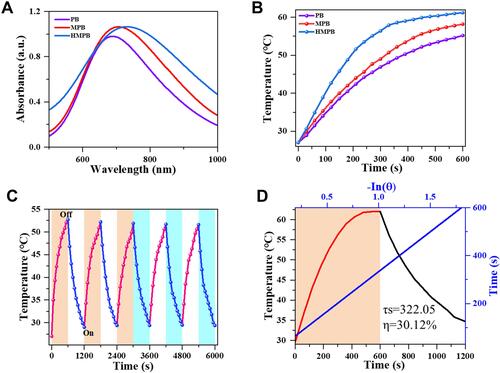
Figure 3 PC B2 loading and pH-responsive release. (A) N2 adsorption-desorption isotherms of MPB NPs and HMPB NPs. (B) UV-visible absorption spectroscopy of PC B2 solutions before and after interaction with HMPB NPs (inset: the representative photos of PC B2 solution before (left) and after interaction with HMPB NPs (middle: before centrifugation, right: after centrifugation)). (C) Degradation curve of HMPB NPs at different pH values (5.0, 7.2). (D) In vitro release of PC B2 in HMPB@PC B2 at different pH values (5.0, 7.2).
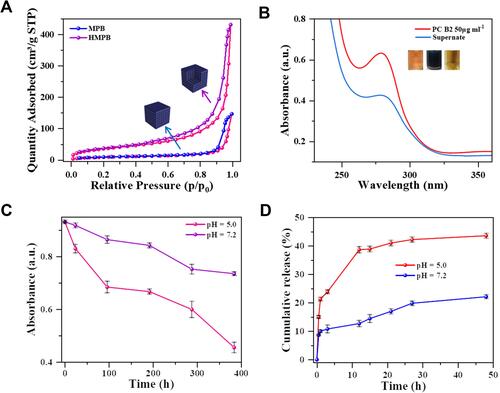
Figure 4 In vitro synergistic therapy efficacy. (A and B) Relative cell viabilities of the HeLa cells in various treatment groups: only HMPB NPs and only NIR laser. (C) Relative viability of HeLa cells under NIR laser irradiation with different concentrations of HMPB NPs. (D) Relative cell viabilities of Hela cells in various treatment groups (HMPB, HMPB@PC B2: 100 μg mL−1; PC B2: 40 μg mL−1). (E) Flow cytometry analysis of Hela cells’ apoptosis in various treatment groups. (*p < 0.05; **p < 0.01; and ***p < 0.005).
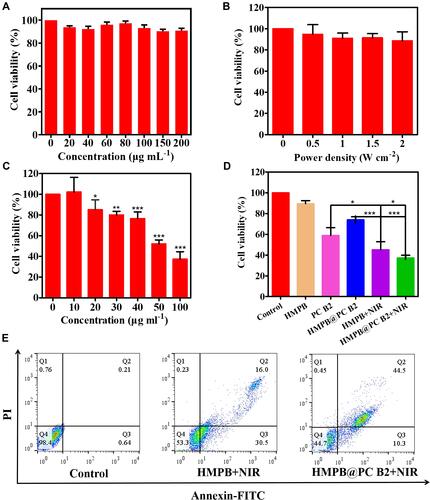
Figure 5 (A) CLSM images of Hela cells stained by Calcein-AM/PI in treatment groups. (B) Quantitative analysis of the relative fluorescence intensity in the two treatment groups. (C) Waterfall plot of the relative fluorescence intensity in the two treatment groups. (***p < 0.005).
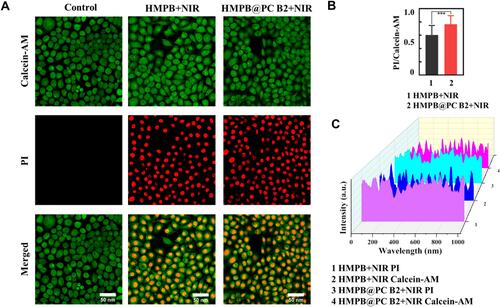
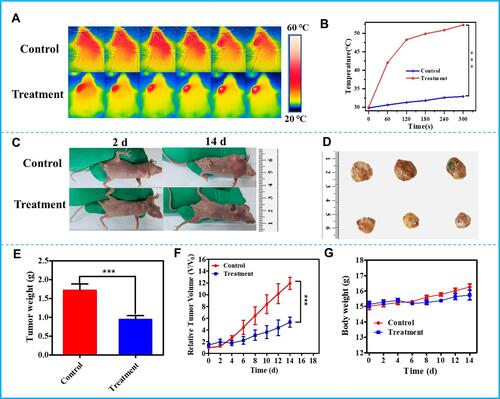
Figure 6 In vivo therapeutic efficacy of HMPB@PC B2. (A) In vitro thermographic images of tumor-bearing mice after injection of PBS, HMPB@PC B2 with 808 nm NIR laser irradiation, and (B) the corresponding temperature changes at the tumor site of mice under 808 nm NIR laser irradiation (1W cm−2) in different groups. (C) Digital images of the nude mice before and after treatment. (D) Digital images of tumors dissected from each group at the end of treatments. (E) Tumor weight changes in various treatment groups. (F) Relative tumor volume changes and (G) body weight changes in various treatment groups within 14 days. (***p < 0.005).