Figures & data
Figure 1 Cytotoxic effects as measured by MTT assay after 24 hours incubation with 50 nM p53siRNA, in the presence or absence of 10 μM EGCG, and siPORT™ NeoFX™ transfection agent on HeLa cell line (mean ± standard deviation, n = 6; P ≤ 0.05 compared with the control group).
Abbreviations: EGCG, (−)-epigallocatechin-3-gallate; MTT, 3-(4,5-dimethylthiazol-2-yl)-2,5-diphenyltetrazolium bromide; siRNA, short interfering RNA.
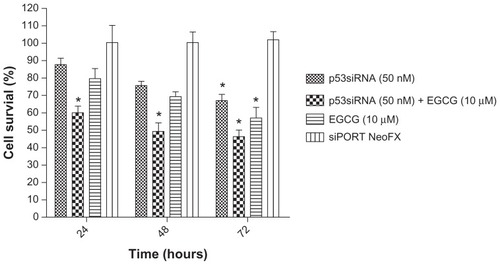
Table 1 Apoptosis-related genes with altered expression levels following 24 hours of incubation with p53siRNA, p53siRNA+EGCG, or EGCG
Figure 2 The clustergram generated for differentially expressed genes (P < 0.05, cut-off fold change 1.25) in treated versus control samples.
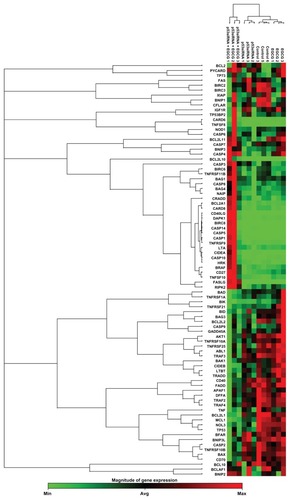
Figure S1 The canonical network associated with the genes involved in cancer apoptosis mediated by (A) EGCG, (B) p53siRNA, and (C) p53+EGCG.
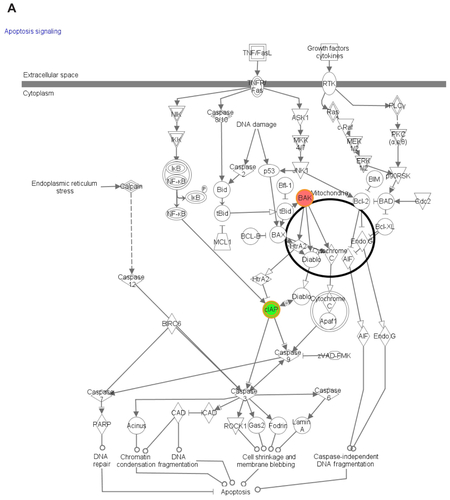
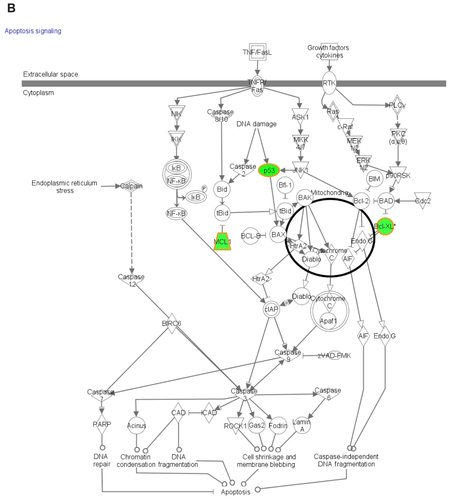
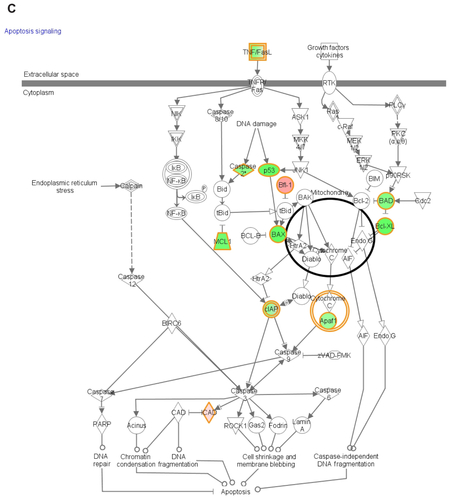
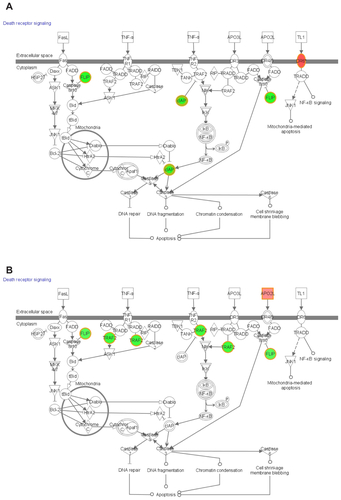
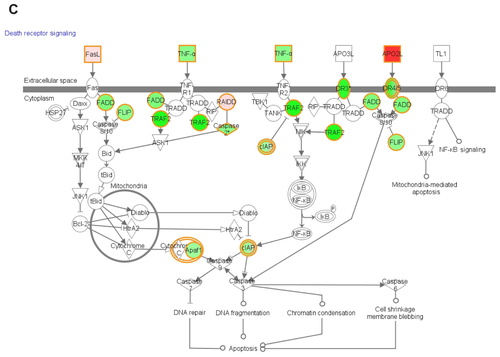
Figure S2 The canonical network associated with the genes involved in death receptor signalling mediated by (A) EGCG, (B) p53siRNA, and (C) p53+EGCG.