Figures & data
Scheme 1 Schematic illustration of one-step fabrication of PLGA-HMME-DTX@MnO2 nanoparticle via flash nanoprecipitation method.
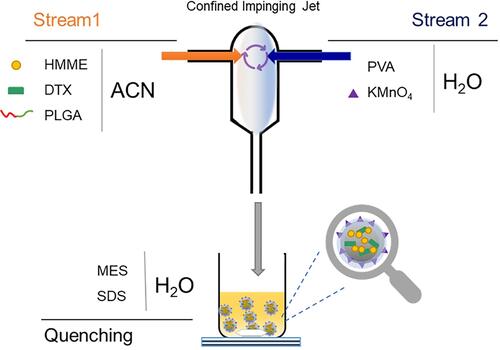
Table 1 Grouping and treatment in vivo
Figure 1 In vitro assessment of therapeutic efficacy. (A) Schematic illustration of the therapeutic process. (B) Bodyweight curves and (C) tumor growth curves of mice in different groups (*p<0.05, **p<0.01). (D) Photos of tumors collected from different groups. (E) Expression levels of HIF-1α in tumor tissues. (F) H&E staining of tumors in different groups after various treatments.
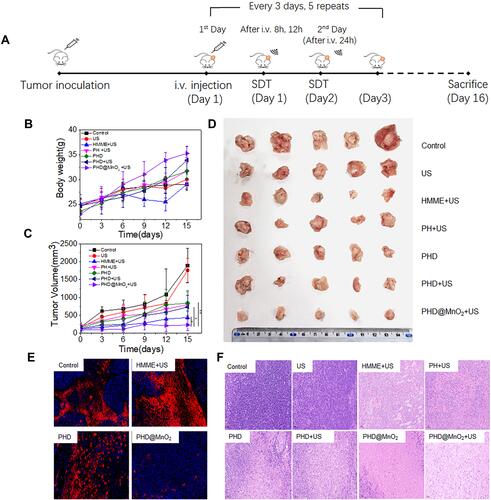
Figure 2 Preparation and characterization of nanoparticles. (A) Photo of (a) PLGA, (b) PLGA-HMME (c) PLGA-HMME-DTX and (d) PLGA-HMME-DTX@MnO2 nanoparticles in buffer. (B) Zeta-potential of four nanoparticles. (C) PLGA-HMME-DTX@MnO2 nanoparticle after lyophilization. (D) TME images of PLGA-HMME-DTX@MnO2 nanoparticles (The black scale bars represent 100 nm). (E) Particle-size distribution of PLGA-HMME-DTX@MnO2.
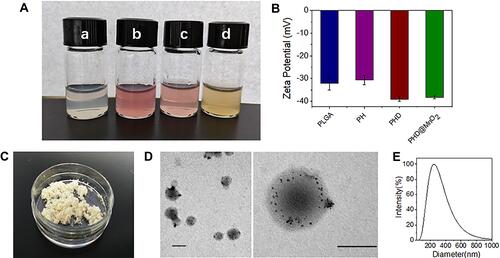
Figure 3 (A) Fluorescence emission spectrum of HMME and PHD@MnO2. (B) XPS spectrum of PLGA-HMME-DTX@MnO2 nanoparticle. (C) FT-IR infrared spectra of MnO2 and PLGA-HMME-DTX@MnO2 nanoparticle. (D) Ultrasound-irradiated singlet oxygen generation in vitro. (E) Ultrasound-irradiated hydroxy radical generation in vitro. (F) Cumulative release curves of PLGA-HMME-DTX@MnO2 with or without ultrasound in different conditions (pH= 7.4 and 5.3).
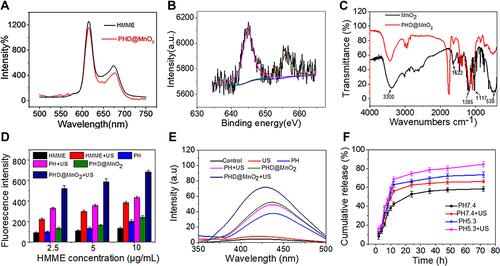
Figure 4 (A) cellular uptake of PLGA-HMME-DTX@MnO2 into MCF-7 cells. The white scale bars represent 25 μm. (B) MCF-7 cell viability under different treatments. (C) The intracellular GSH concentration under the treatment of nanoparticles with MnO2. (*p<0.05, **p<0.01).
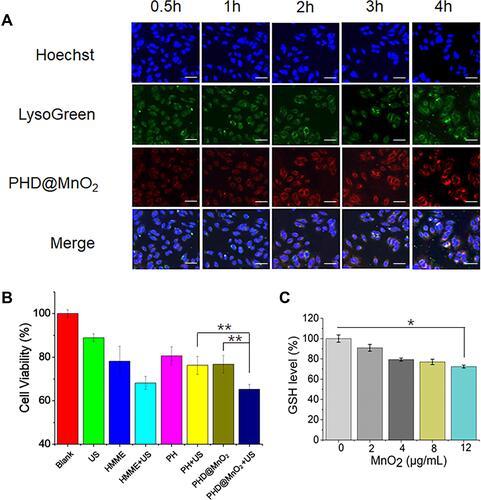
Figure 5 Cellular ROS generation in MCF-7 cells. (A) Microscopy images of intracellular ROS generation by DCFH-DA. The white scale bars represent 25 μm. (B) Mean optical density of green fluorescence in different groups quantified by ImageJ software.
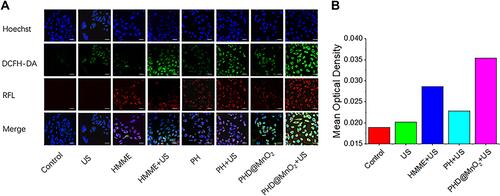
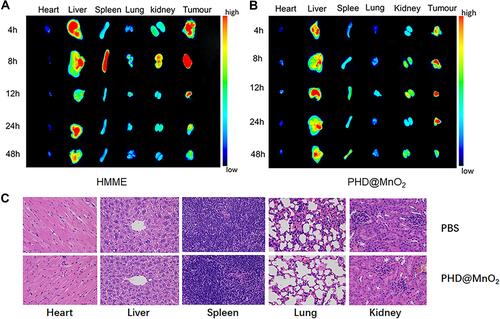
Figure 6 In vitro biodistribution and biocompatibility. (A) Fluorescence images of isolated organs and tumors at different time point after HMME injection. (B) Fluorescence images of isolated organs and tumors at different time point after PLGA-HMME-DTX@MnO2 injection. (C) H&E staining sections of organs after PLGA-HMME-DTX@MnO2 treatment.