Figures & data
Figure 1 Fractogram of the placebo extrudate.
Notes: Red line: Rayleigh ratio (1/cm) (light-scattering signal at angle 90°); green line, UV/Vis signal; blue line, differential refractive index.
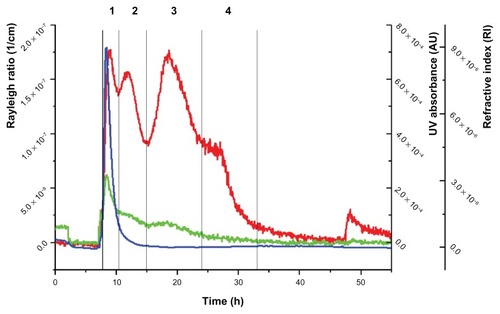
Table 1 Molecular structures and physical and chemical properties of the ingredients
Table 2 Composition of the extrudates
Table 3 Placebo extrudate: peaks and sizes
Figure 2 Comparison of the placebo extrudate (black) with PVP/VA 64.
Notes: Solid line, refractive index; dotted line, molecular mass.
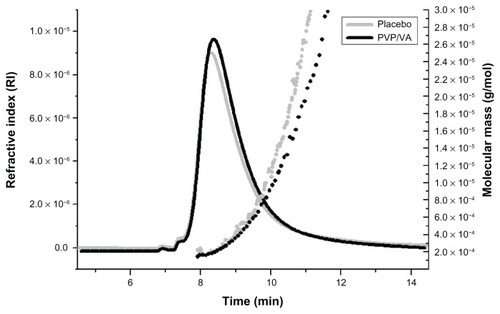
Figure 3 Fractogram of the mixture of sucrose palmitate and polysorbate 80.
Notes: Red line, Rayleigh ratio (1/cm) (light-scattering signal at angle 90°); green line, UV/Vis signal; blue line, differential refractive index.
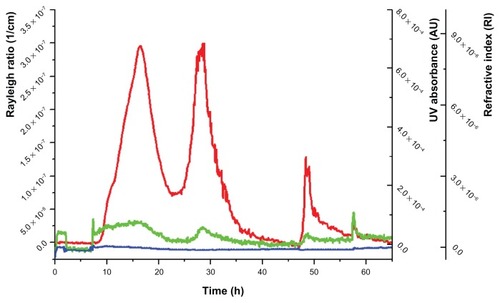
Table 4 Overview of the peaks in the ternary mixtures
Figure 4 Fractogram of the ABT-102–containing extrudate.
Notes: Red line, Rayleigh ratio (1/cm) (light-scattering signal at angle 90°); green line, UV/Vis signal; blue line, differential refractive index.
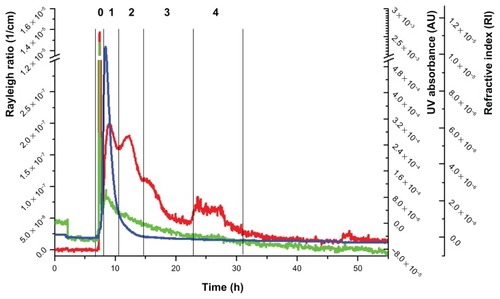
Figure 5 Distribution of ABT-102 over the fractions of peaks 0–4 of the centrifuged sample.
Note: The total injected amount was 1.46 μg ± 0.26 μg (calculated from apparent solubility data).
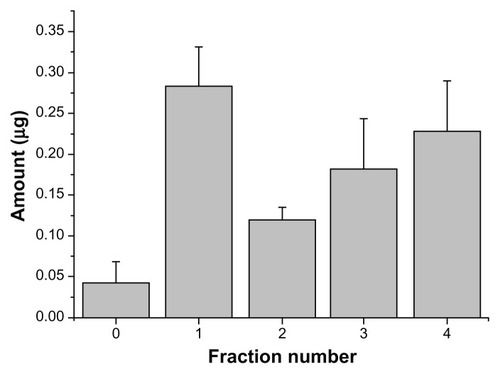
Figure 6 SEM images of crystalline ABT-102 (A) and the freeze dried precipitate (B).
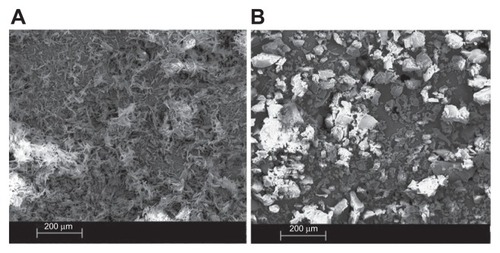
Figure 7 (A and B) Powder X-ray diffractogram of the precipitate and of crystalline ABT-102. (A) (Brown line): crystalline ABT-102; (B) (green line): precipitate.
Note: The diffractogram of crystalline ABT-102 was downscaled two times by factor 0.0125.
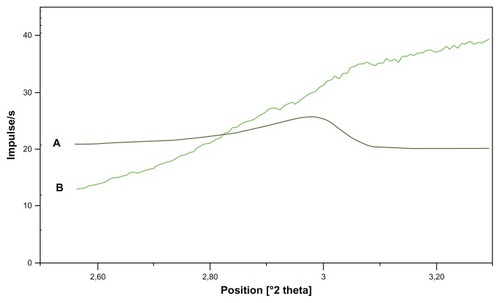
Table 5 Overview of the bands in the FT-IR spectra in
Figure 8 (A–G) FT-IR spectra of the dried precipitate (from a dispersion in water and in buffer), and for comparison, the spectra of ABT-102 (crystalline) and the excipients. (A) (Violet): precipitate in water; (C) (blue): precipitate in buffer; (B) (green): PVP/VA 64; (D) (light blue): polysorbate 80; (E) (red): ABT-102; (F) (black): poloxamer 188; (G) (dark green): sucrose palmitate.
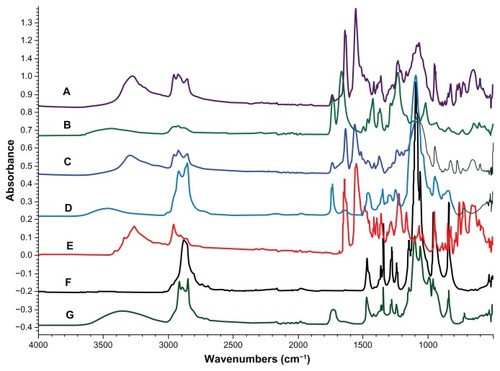
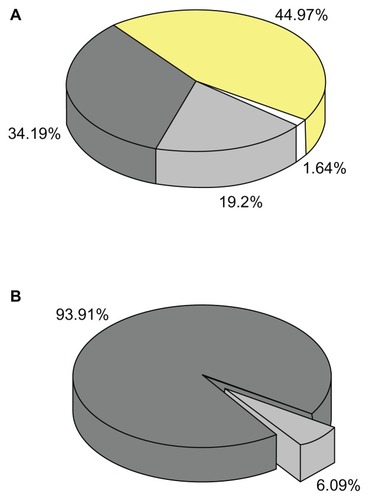
Figure 9 (A) Contribution of various structures to the apparent solubility; 100% = 9.74 μg/mL; white, molecular dissolved ABT-102; light grey, polymericbound; dark grey, micellar-bound; yellow, loss due to poor recovery of the AFlFFF experiment. (B) Distribution of ABT-102 in the complete sample dispersion; 6.09% = 9.74 μg/mL; 100% = 160 μg/mL (weight in amount); light grey, dissolved fraction; dark grey, microparticulate structures.