Figures & data
Figure 1 FGF1 variant dedicated for specific conjugation with gold nanoparticles. (A) The spatial structure of FGF1 with the introduced mutations (based on PDB: 2Q9X). Side chains of mutated residues involved in stability effects are represented in orange; mutations designed to facilitate thiol-mediated conjugation are marked in red. (B) Fluorescence (upper panel) and circular dichromism (lower panel) spectra of native wild-type FGF1, native FGF1V, and denaturated FGF1V at a protein concentration of 2 × 10⁻⁶ M in 25 mM sodium phosphate buffer, pH 7.3. (C) Normalized thermal denaturation curves of FGF1 wild-type (in black) and engineered FGF1V variant (in blue). Changes in ellipticity were monitored at 228 nm wavelength, in the presence of 0.7 M GdmCl in 25 mM sodium phosphate buffer, pH 7.3, and at a protein concentration of 2 × 10⁻⁶ M. (D) Proliferative activity of FGF1V and wild-type FGF1 measured by the MTT assay.
Notes: Starved NIH 3T3 cells were incubated with the growth factor for 48 hours in the presence of 10 U/mL heparin. Equal volume of PBS was added to the control samples. Results shown are mean values from four experiments. Bars indicate +/− standard deviation.
Abbreviations: FGF1, fibroblast growth factor 1; PDB, Protein Data Bank; FGF1V, fibroblast growth factor 1 variant; MTT, 3-(4,5-dimethylthiazol-2-yl)-2,5-diphenyltetrazolium bromide; NIH 3T3, mouse embryonic fibroblast cell line; PBS, phosphate buffered saline.
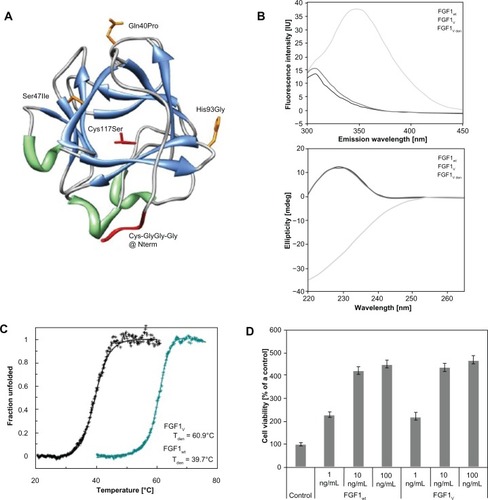
Figure 2 Biophysical characterization of AuNP conjugates. (A) Scheme of the two-step functionalization of AuNPs with FGF1V based on the gradual exchange of detergent molecules for the protein. (B) UV-Vis spectrum of the synthesized gold colloids and FGF1V-coated gold colloids (FGF1V-AuNPs). (C) Transmission electron microscopy image of gold colloid solution and AuNPs coated with FGF1V. Bar equals to 100μm. (D) DLS analysis of AuNPs coated with FGF1V (upper panel) and synthesized unconjugated AuNPs (lower panel). (E) UV-Vis spectra of AuNPs treated with high salt concentration, coated with the FGF1V (FGF1V-AuNPs) and aggregated AuNPs without any coating agent.
Note: The observed shift of absorption maximum corresponds to nanoparticle aggregation, as the conjugates coated with FGF1V are a lot more stable.
Abbreviations: AuNP, gold nanoparticle; Au, gold; FGF1V, fibroblast growth factor 1 variant; UV-Vis, ultraviolet visible spectroscopy; DLS, dynamic light scattering.
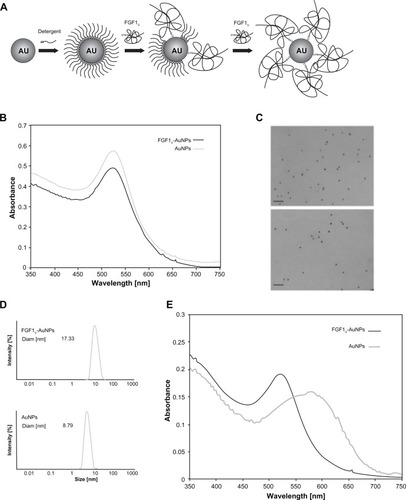
Table 1 Detergents tested for the preparation of gold colloids coated with FGF1V
Figure 3 Biophysical characterization of FGF1V-gold nanoparticles. (A) Mass spectrometry analysis of intact FGF1V. (B) Mass analysis of FGF1V-gold nanoparticles reduced with TCEP. (C) Western blot analysis of conjugates and their preparation steps with anti-FGF1 antibody. Upon SDS-PAGE, separation FGF1V can be detected only after reduction by TCEP – when released from the nanoparticle surface. (D) Mass spectrometry analysis of trypsin digest of FGF1V-coated gold nanoparticles.
Note: Tryptic peptides corresponding to the FGF1V sequence are annotated.
Abbreviations: FGF1V, fibroblast growth factor 1 variant; TCEP, tris(2-carboxyethyl)phosphone; FGF1, fibroblast growth factor 1; SDS-PAGE, sodium dodecyl sulfate polyacrylamide gel electrophoresis.
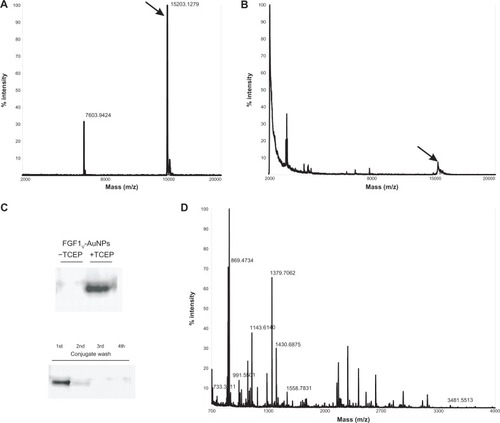
Figure 4 Biological activity of FGF1V-AuNP conjugates. (A) Cell proliferation in response to FGF1V, FGF1V-AuNPs, and nanoparticle colloids alone (AuNPs) measured using Alamar Blue assay. Starved NIH 3T3 cells were incubated with the growth factor for 48 hours in the presence of 10 U/mL heparin. Equal volume of PBS was added to the control samples. Results shown are mean values from four experiments. Bars indicate +/− standard deviation. (B) Activation of signaling cascades in NIH 3T3 cells after incubation with increasing concentrations of FGF1V, FGF1V-AuNPs, and nanoparticle colloids alone (AuNPs) detected with Western blot analysis.
Notes: 1*, 10*, and 100* ng/mL AuNPs denotes the concentration of AuNPs equal to the concentration of AuNPs in 1*, 10*, and 100* ng/mL FGF1V-AuNPs.
Abbreviations: FGF1V, fibroblast growth factor 1 variant; AuNP, gold nanoparticle; PLCγ, phospholipase C-gamma; NIH 3T3, mouse embryonic fibroblast cell line; PBS, phosphate buffered saline.
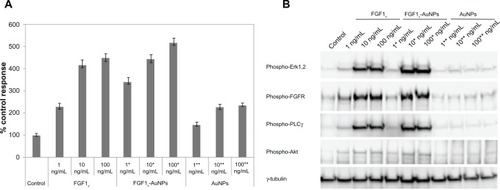
Figure 5 Receptor-specific internalization of FGF1V or FGF1V-AuNPs visualized with confocal fluorescence microscopy.
Notes: U20S R1 and U20S cells were incubated with fluorescently labeled FGF1V-AuNPs (FITC, FGF1V-AuNPs), and fluorescently labeled FGF1V (FITC, FGF1V). AuNPs were detected with confocal reflectance and cell nuclei were visualized with Hoechst staining. Only cells expressing FGF receptor internalized conjugates.
Abbreviations: FGF1V, fibroblast growth factor 1 variant; AuNPs, gold nanoparticles; FITC, fluorescein isothiocyanate.
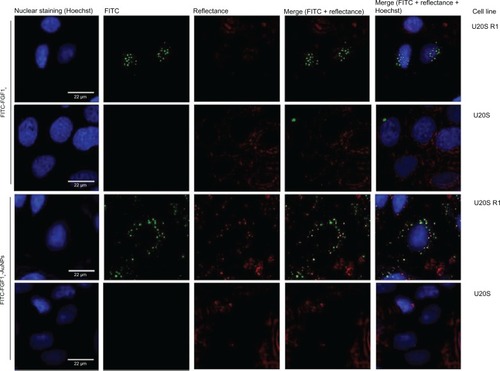
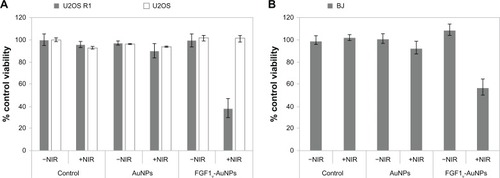
Figure 6 Decrease in viability of FGFR-positive cells after irradiation with NIR. (A) U20S R1 and U20S, and (B) BJ cells treated with FGF1V-AuNPs show significantly decreased viability irradiated with NIR.
Notes: Results shown are mean values from three experiments. Bars indicate +/− standard deviation. Cells were treated with NIR (808 nm diode laser, 1.2 A) for 20 minutes, and the visibility was measured by the MTT assay 12 hours after NIR treatment. Equal volume of PBS was added to the control samples.
Abbreviations: FGFR, fibroblast growth factor receptor; NIR, near-infrared; FGF1V, fibroblast growth factor 1 variant; AuNPs, gold nanoparticles; MTT, 3-(4,5-dimethylthiazol-2-yl)-2,5-diphenyltetrazolium bromide; PBS, phosphate buffered saline.