Figures & data
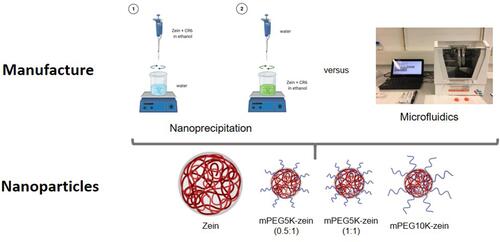
Figure 1 Manufacture of zein nanoparticles using a microfluidic cartridge coupled with a NanoAssemblrTM device.
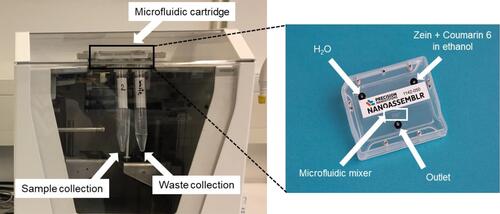
Table 1 Composition of the Three mPEG-Zein Synthesized in the Study
Figure 2 Impact of the manufacturing method on zein nanoparticle characteristics. (A) Morphology of CR6-loaded zein nanoparticles visualized by TEM (scale bar: 200 nm). (B) Physicochemical characteristics (size, polydispersity index (PDI), and surface charge), entrapment efficiency (EE), and yield of CR6-loaded zein nanoparticles (n=6) (*P < 0.05).
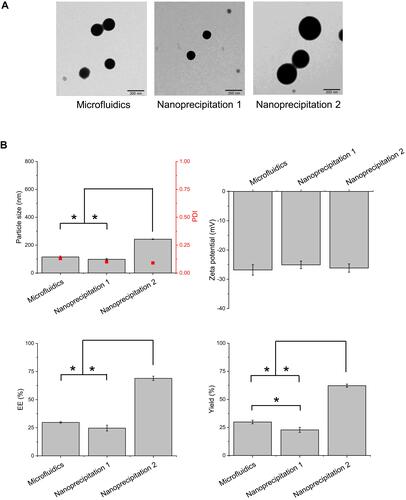
Figure 3 Unstained TEM images of zein, mPEG5K-zein (0.5:1), mPEG5K-zein (1:1), and mPEG10K-zein nanoparticles. All nanoparticles were prepared using nanoprecipitation Method 2 (scale bar: 200 nm).
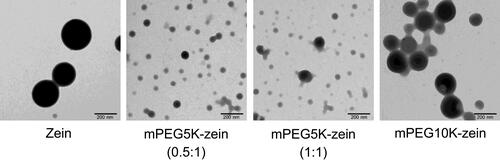
Table 2 Characteristics of Zein and mPEG-Zein Nanoparticles Prepared by Nanoprecipitation Method 2 (n = 6)
Figure 4 Stability of zein (A) and mPEG-zein (B) nanoparticles loading CR6 after storage at 4°C for 4 weeks (n = 6). Nanoparticles were prepared by nanoprecipitation Method 2. Error bars are smaller than the symbols when not visible.
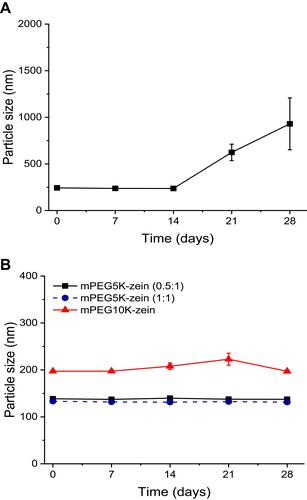
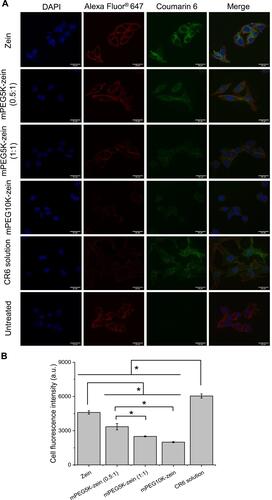
Figure 5 Cellular uptake of CR6 loaded in zein and mPEG-zein nanoparticles by B16-F10-luc-G5 cells. (A) Confocal images of the cellular uptake of CR6 loaded in zein and mPEG-zein nanoparticles, or as a solution (scale bar: 25 µm). (B) Flow cytometry analysis of the cellular uptake of CR6 loaded in zein and mPEG-zein nanoparticles, or as a solution (a.u.: arbitrary units) (n = 6) (*P < 0.05).