Figures & data
Figure 1 (A) The preparation and (B) anti-HCC mechanism of CUR-APR/HA&GA-LPs.
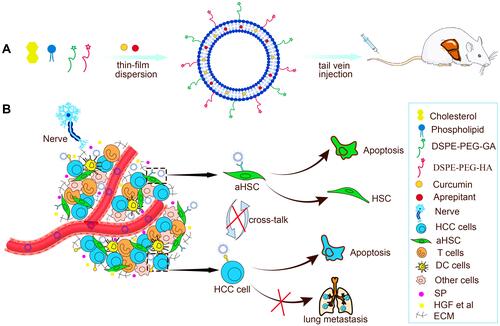
Table 1 Characterization of the Different Liposomal Formulations
Figure 2 In vitro characteristics of CUR-APR/HA&GA-LPs. TME images (scale bar: 200 nm) and particle size distribution of CUR-APR/HA&GA-LPs (A) and Blank liposomes (B). (C) The stability of CUR-APR/HA&GA-LPs in PBS (PH 7.4) and RPMI 1640 medium, respectively. (D) The cumulative release of CUR and APR from CUR-APR/HA&GA-LPs.
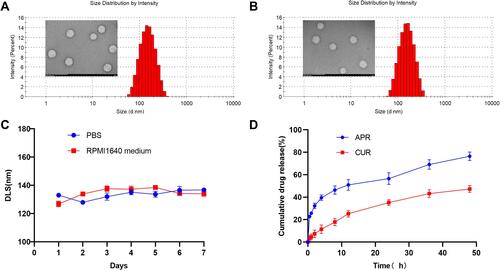
Figure 3 Cellular uptake of (A) and drug retention assay (B) of HA&GA-LPs. (C) CLSM images of SMMC-7721 cells uptake (green: FITC, blue: DAPI). (D and E) FCM analysis of cell uptake in SMMC-7721 cells. The drug retention assay using CLSM (F) and FCM (G) against co-cultured cell model (green: C6, blue: DAPI). (H) Quantitative analysis of drug retention by FCM. Scale bar: 50 μm, *P < 0.05, **P < 0.01, ***P < 0.001.
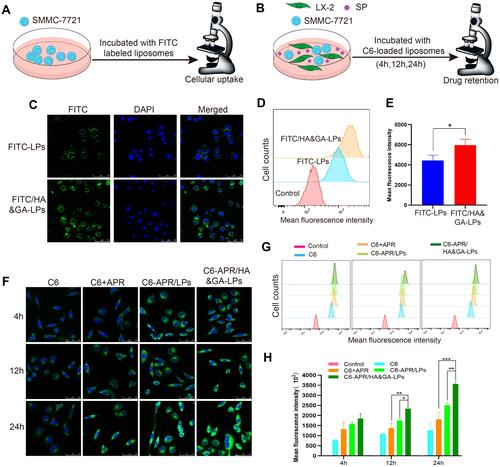
Figure 4 In vitro cytotoxicity assay. MTT assay against SMMC-7721 cells (A) and co-cultured cell model (B). Cytotoxicity of SMMC-7721 cells (C) and co-cultured cells (D) incubated with different drug formulations for 48 h. (E) The live/dead staining assay of co-cultured cell model (PI: red, Calcein-AM: green). Scale bar: 100 µm, *P < 0.05, **P < 0.01, ***P < 0.001.
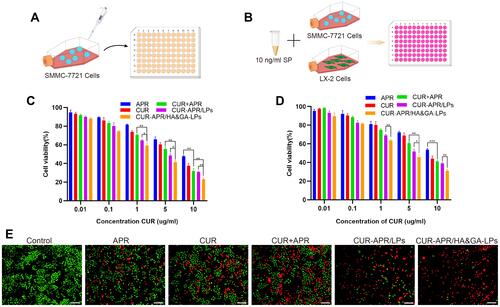
Figure 5 In vitro anti-migration effect. A wound healing assay against SMMC-7721 cells (A) and co-cultured cells model (D). Cell migration images (C) and the migration ratio (B) of SMMC-7721 cells. Cell migration images (F) and the migration ratio (E) of co-cultured cells model. (G) Images of transwell assay in co-cultured cell model after treatment of various drug formulations. Scale bar: 100 µm. (H) Quantification of migrated cells in transwell assay. *P < 0.05, **P < 0.01.
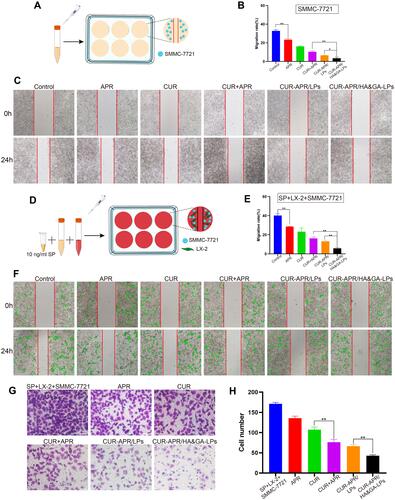
Figure 6 The in vivo biodistribution and drug penetration of HA&GA-LPs. (A) The in vivo biodistribution imaging of different formulations at different time points (2, 6, 12, 24, and 48 h). The ex vitro fluorescence imaging (B) and fluorescence quantitative analysis (C) of major organs and tumors. (fluorescence: DiR). (D) CLSM images of tumor penetration (red: DiD, blue: DAPI). Scale bar: 50 µm, *P < 0.05.
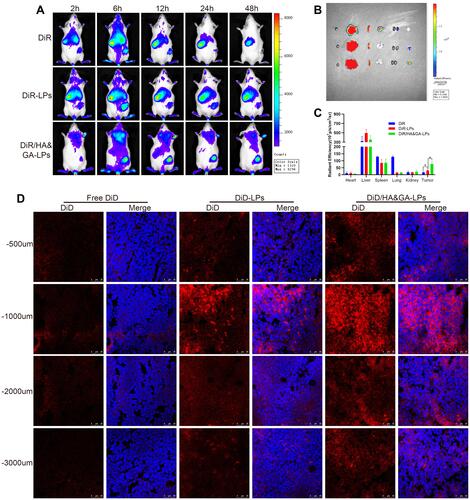
Figure 7 In vivo antitumor activity in “SP+m-HSCs+H22” tumor-bearing mice. (A) Schematic illustration of treatment scheme on mice. (B) Tumor images of mice treated with different drug formulations. (C) The body weight in mice. (D) Tumor growth inhibition curves. (E) Tumor growth inhibition rate. H&E (F), and Masson trichromatic staining (G) analysis of tumor tissues slices. (H) α-SMA immunofluorescence staining (green fluorescence: α-SMA protein). Immunohistochemical assay of PGP9.5 proteins (I) and CD31 proteins (J). (red arrow: CD31 proteins). Scale bar: 50 μm, *P < 0.05, **P < 0.01, ***P < 0.001.
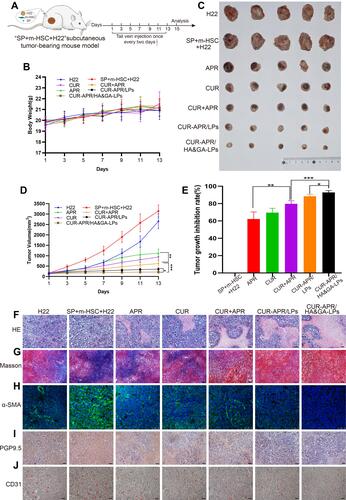
Figure 8 H&E staining images of heart, liver, spleen, lung and kidney of mice treated with different drug formulations. Scale bar: 50 μm.
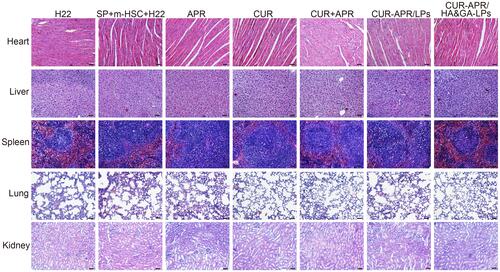
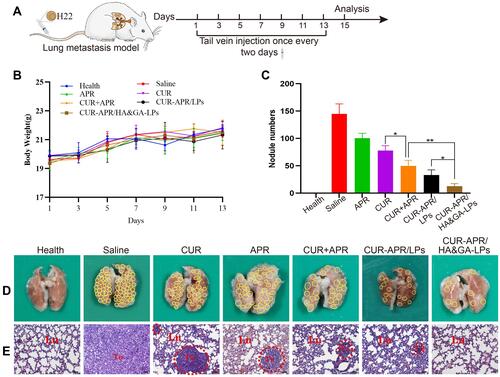
Figure 9 In vivo anti-lung metastasis analysis in mice. (A) Establishment of mice model of lung metastasis and schematic illustration of treatment scheme. (B) Variations of body weights in mice. (D) Lung images. (The yellow circles indicated lung nodules). (C) Quantitative analysis of lung nodule numbers. (E) H&E staining of lung tissue slices (scale bar: 50 μm). (The red circles showed tumor region). *P < 0.05, **P < 0.01.