Figures & data
Table 1 Primer Sequences Used for Real-Time RT-PCR
Figure 1 (A) Graphic illustration of preparation mechanism of riclin, and riclin/AgNPs hydrogels; (B) UV–vis absorption spectra of aqueous dispersions of AgNPs; (C) XRD pattern of riclin hydrogels; (D) XRD pattern of riclin/AgNPs hydrogels; (E) TEM images of AgNPs; (F) Particle size distribution of AgNPs; (G) Zeta potential of the synthesized AgNPs.
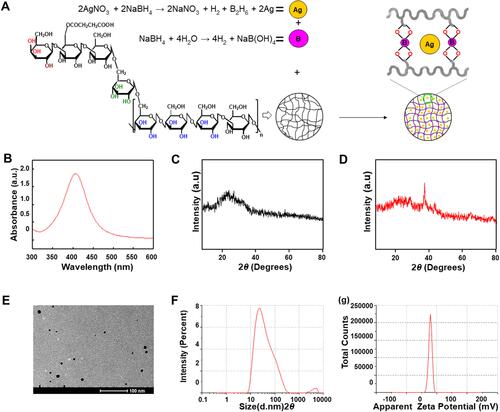
Figure 2 Rheological and moisture retention properties of pristine riclin and riclin/AgNPs hydrogel. (A) Shear stress of the samples per weight as a function of the shear rate; (B) viscosity vs shear rate; (C) storage modulus (G′, solid symbols) and loss modulus (G′′, hollow symbols) as a function of the strain amplitude; (D) moisture retention curve of riclin and riclin/AgNPs hydrogel.
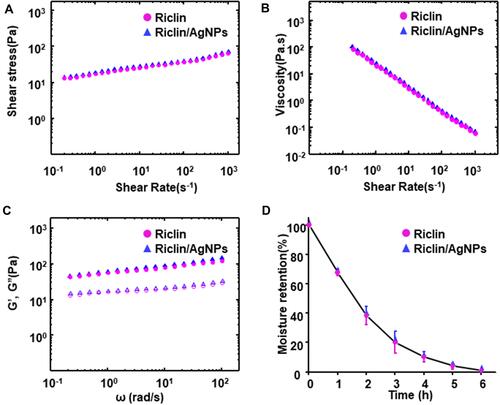
Figure 3 (A) In vitro release of AgNPs are compared between control (AgNPs) and treatment (riclin/AgNPs). Loading of AgNPs into hydrogel was resulted in a prolonged release pattern of the nanoparticles over 48 hours of exposure; (B) in vitro degradation of riclin/AgNPs hydrogel. (C) The pictures of riclin/AgNPs hydrogel at different degradation time.
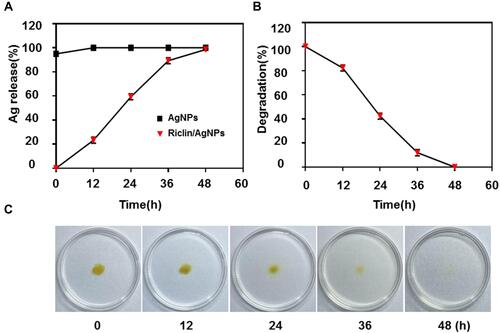
Figure 4 Antibacterial activity of pristine riclin and riclin/AgNPs hydrogels against E. coli (A) and S. aureus (B); all data are presented by the mean ± standard deviation (SD, n = 3) (p < 0.05); Viability of NIH3T3 mouse fibroblasts (C) and Raw 264.7 (D) after 24-h exposure to different concentrations of AgNPs and riclin/AgNPs composed hydrogel.
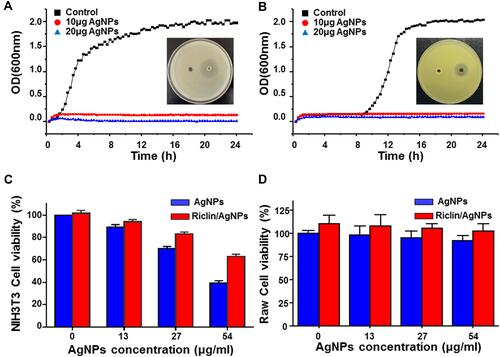
Figure 5 Effect of test samples on the healing of S. aureus-infected wounds in C57BL/6 mice. (A) Representative photographs of the healing of S. aureus-infected wounds treated with riclin or riclin/AgNPs. (B) Percentage of the area reduction of mouse skin lesions relative to the initial wound. Data are the mean ± standard deviation (n = 6); *P < 0.05, compared with the untreated group.
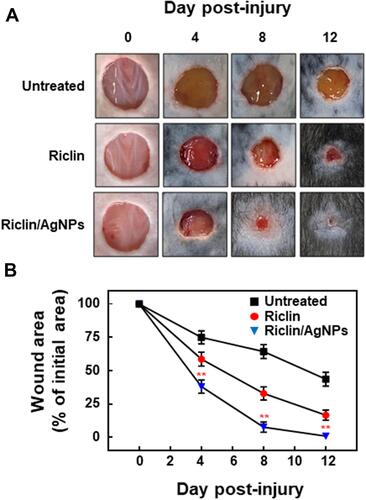
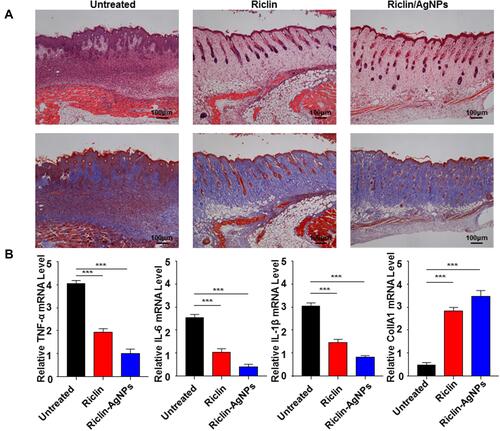
Figure 6 (A) Histological (H&E and MT staining) analysis of S. aureus-infected wounds in C57BL/6 mice. Scale bar = 100 μm; H&E, hematoxylin and eosin; MT, Masson’s trichrome. Red arrows indicate blood vessels; blue arrows indicate early epithelialization, pink arrows indicate fibroblasts, and Orange arrows indicate mononuclear inflammatory cells. The blue color in the MT-stained tissue indicates collagen, arranged parallel to the skin surface. (B) Gene expression analysis of IL-6, IL-1β, TNF-α inflammatory mediators in wounds treated with hydrogels of riclin and riclin/AgNPs after 8 days of treatment. Data are presented as mean ± SD, n = 3. One-way ANOVA was used to evaluate the statistical differences, ***Represents p < 0.001.