Figures & data
Scheme 1 Schematic illustration of synthetic bFGF@MSNs-mediated induction of bone defect repair and the mechanism of osteogenic induction.
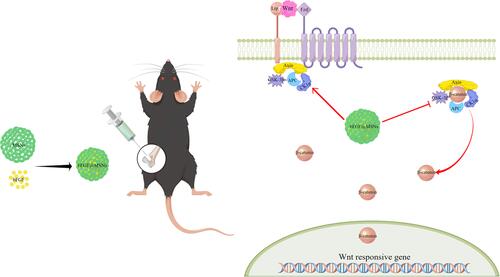
Table 1 Primers for Real-Time PCR
Figure 1 (A) The surrounding soft tissue was isolated, and distal femur was exposed. (B) Creation a 1 mm diameter distal femur defect. (C) Sterilized MSNs and bFGF@MSNs solution were injected into the bone defects. (D) Sealing of the opening of defect with bone wax.
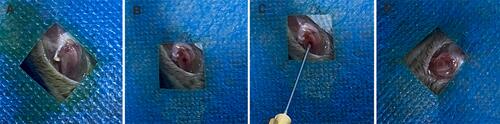
Figure 2 Characterization of bFGF@MSNs: (A and B) SEM characteristics, (C) diameter and (D) zeta potential of MSNs and bFGF@MSNs.
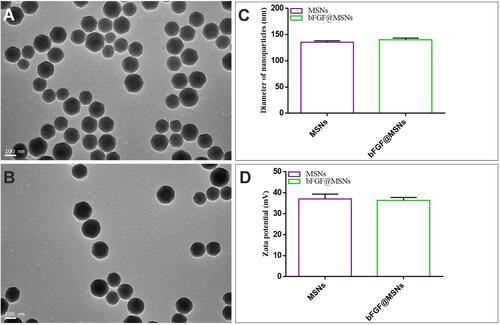
Table 2 Cumulative Release of bFGF in vitro
Figure 3 (A) The profile of cumulative bFGF release from bFGF@MSNs. (B) Si ions released from MSNs and bFGF@MSNs.
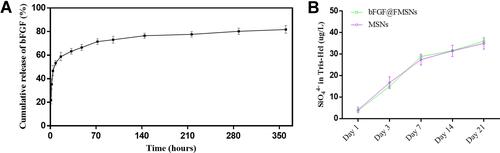
Figure 4 (A) Cell survival was analysed at different bFGF@MSNs concentrations. *p < 0.05 versus a 0 μg/L bFGF@MSNs concentration. (B) Proliferation of MC3T3-E1 cells cultured with or without nanoparticles (MSNs or bFGF@MSNs) in standard medium. *p < 0.05 versus the control group, #p < 0.05 versus the MSNs group. (C) Representative images of the morphologies of MC3T3-E1 cells. Green represents the cytoskeleton, and blue represents the cell nucleus. (D) Representative images of live/dead staining of MC3T3-E1 cells. Green represents live cells, and red represents dead cells.
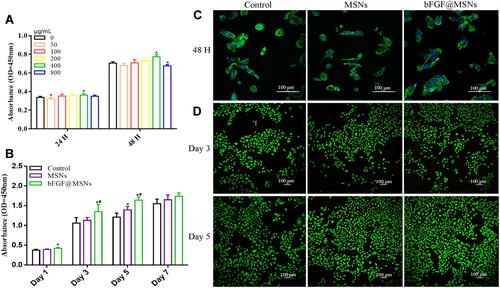
Figure 5 In vitro evaluation of osteogenic differentiation of MC3T3-E1 cells after stimulation with MSNs, bFGF@MSNs and bFGF@MSNs in DKK1 inhibitor-containing conditioned media. (A) Alizarin red S staining. (B) Alkaline phosphatase staining. (C) Quantitative analysis of mineralized nodules. (D) Alkaline phosphatase activity. *p < 0.05 versus the control group, #p < 0.05 versus the MSNs group, ap < 0.05 versus the bFGF@MSNs group.
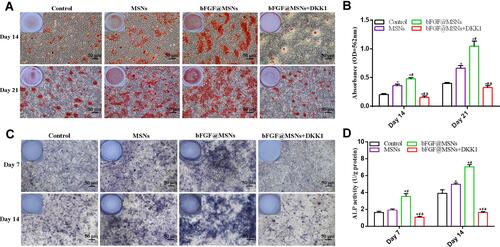
Figure 6 bFGF@MSNs regulated the biological processed of MC3T3-E1 cells in terms of gene expression and signalling pathways, as shown by transcriptomic analysis. (A) Volcano map of differentially expressed genes in MC3T3-E1 cells. (B) Histogram of differentially expressed genes in Go analysis. (C) Upregulated osteogenesis-related genes in the biological process category. (D) Q-value enrichment map of bFGF@MSNs. The enrichment ratio was calculated as (differentially expressed genes in this pathway/all differentially expressed genes)/(genes annotated to this pathway/all annotated genes). (E) Q-value distribution of enrichment pathway. To filter out differentially expressed genes, |log2 fold-change| ≥1, p value <0.05 and Q value<0.05 were used as cut-offs.
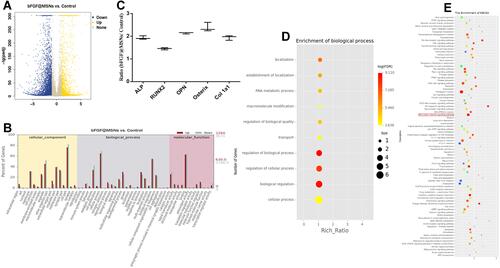
Figure 7 (A) mRNA levels of the osteogenesis-related genes RUNX2, OCN, Osterix and ALP, as determined by real-time PCR. (B) Relative mRNA levels of the Wnt/β-catenin signalling factors β-catenin, LRP5 and GSK-3β, as determined by real-time PCR. (C) Protein levels of the osteogenesis-related proteins RUNX2 and Osterix, as measured by Western blotting. (D) Levels of the Wnt/β-catenin signalling-related proteins β-catenin, LRP5 and GSK-3β, as measured by Western blotting. *p < 0.05 versus the control group, #p < 0.05 versus the MSNs group, and ap < 0.05 versus the bFGF@MSNs group.
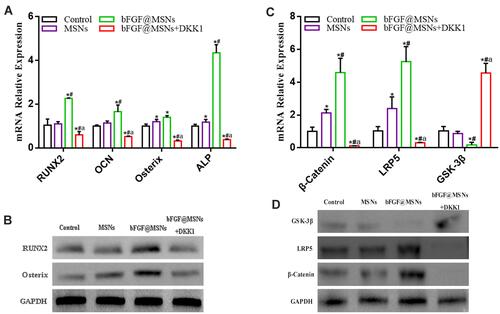
Figure 8 Micro-CT evaluation of bone regeneration in vivo. (A) Representative two-dimensional micro-CT images at 0, 2 and 4 weeks after surgery. (B) Reconstructed three-dimensional micro-CT images at 0, 2 and 4 weeks after surgery. (C) Bone mineral density at 2 and 4 weeks after surgery. (D) Bone volume fraction at 2 and 4 weeks after surgery. *p < 0.05 versus the control group, #p < 0.05 versus the MSNs group.
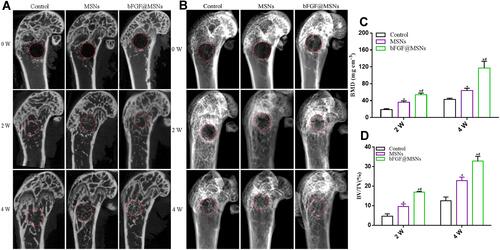
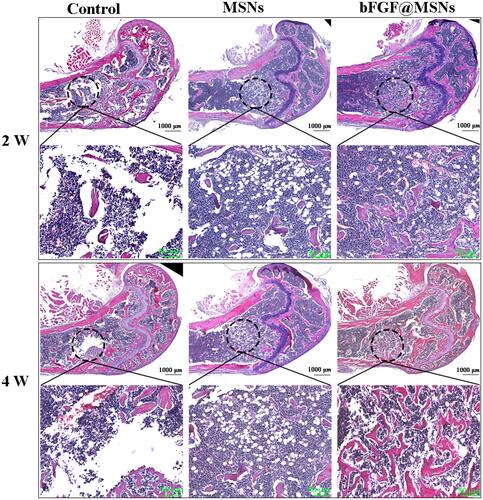
Figure 9 Histomorphological analysis of newly formed tissue by hematoxylin-eosin staining.