Figures & data
Table 1 Characterization of pDNA Encapsulated LNPs with Different C12-200:pDNA Ratio and Composition
Figure 1 Synthesis and characterization of lipid nanoparticles (LNPs) for pDNA delivery in cardiomyocytes. (A) Left: LNPs were formulated via microfluidic mixing of an aqueous phase of pDNA and an ethanol phase of lipids. Right: Schematic formation of LNPs encapsulating pDNA (Right). (B) Hydrodynamic diameter measurements and polydispersity index of LNPs. Bar graph: size; Bar dot: PDI (polydispersity index). (C) Representative cryo-TEM of LNPs encapsulating pDNA. Data are plotted as mean ± SEM.
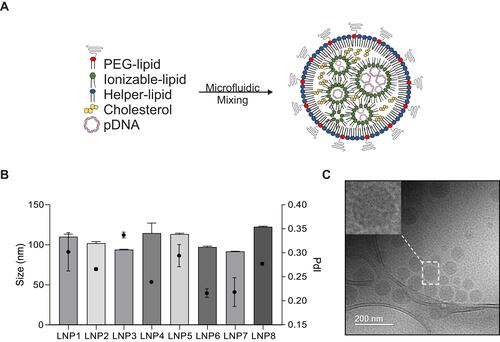
Figure 2 LNP4 showed the highest GFP expression through in vitro screening of LNPs mini-library formulations in cardiomyocytes. (A) Fluorescence photomicrographs of cardiomyocytes 48 h after transfection with 0.4 and 0.8 µg of pDNA loaded in LNPs. (B) Quantification of GFP expression in cardiomyocytes transfected with LNP1-8 at different doses. Data are plotted as mean ± SEM. **p<0.01, ****p<0.0001 by t-test for GFP fluorescence comparison of pDNA quantity and one-way ANOVA followed by Dunnett’s Multiple Comparison post hoc test for GFP of different LNPs compared with the LNP4.
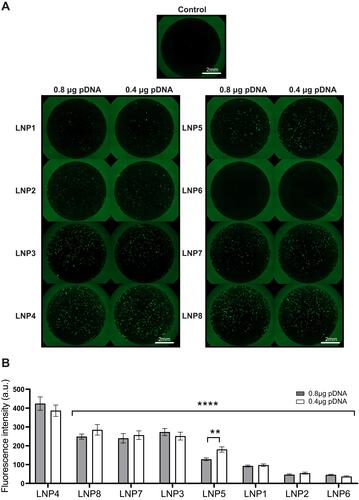
Figure 3 LNPs with higher DOPE and lower cholesterol molar ratio induce enhanced GFP expression in cardiomyocytes. Influence of (A and B) DOPE molar ratio and (C and D) cholesterol molar ratio on GFP expression. Data are plotted as mean ± SEM.
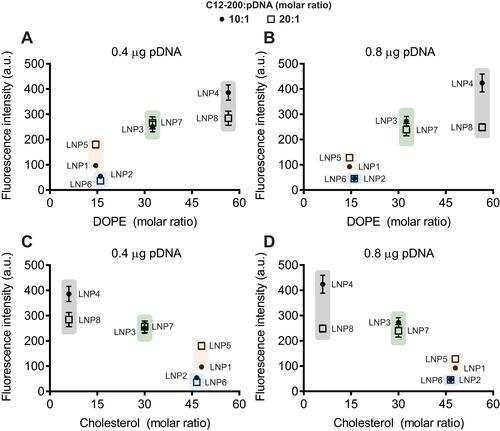
Figure 4 LNP4 shows pKa closer to endosomal pH with higher GFP expression and cellular uptake, not affecting cardiomyocyte viability. (A) Left: Representative images showing uptake of LNP4-6 by cardiomyocytes 2h, 4h, and 6h of LNP4-6 after transfection (0.2 μg of pDNA). LNP4 is predominantly localized into the cell at all-time points analyzed, showing an enhanced uptake over time compared to LNP5-6. Right: Representative split channel images showing the uptake of LNP4-6 6h after transfection. Cardiomyocytes were stained with an antibody specific to alpha-actinin (red), the Nuclei were stained with DAPI (blue). LNP4-6 were labeled with a cholesterol fluorescent tag (green). (B) pKa of LNP4 (C) LNP5 and (D) LNP6. (E) Cardiomyocyte viability 48h after transfection with LNP4-6 and their respective GFP fluorescence. Data are plotted as mean ± SEM. *p<0.05, **p<0.01, ****p<0.0001 by t-test for GFP fluorescence comparison of pDNA quantity and one-way ANOVA followed by Dunnett’s Multiple Comparison post hoc test for viability comparison with the LNP4.
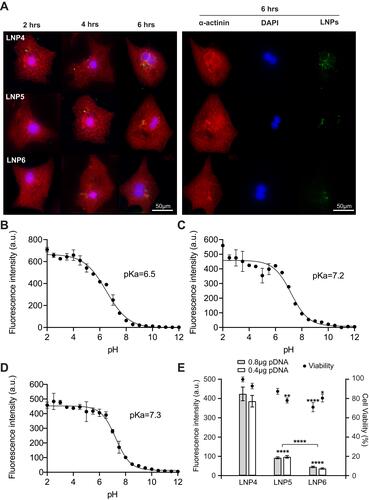
Figure 5 LNP4 transfection efficiency in cardiomyocytes. LNP4 induced a maximum fluorescence on day 4 and a transfection efficiency greater than 60% on day 2 and greater than 80% on day 4. (A) LNP4 dose–response curve showed the optimized amount of pDNA. (B) Representative GFP fluorescence images after treatment of cardiomyocytes with LNP4. (C) Quantification of fluorescence intensity of cardiomyocytes transfected with LNP4 over time. (D) LNP4 transfection efficiency over time. Data are plotted as mean ± SEM. **p<0.01, ****p<0.0001 by one-way ANOVA followed by Dunnett’s Multiple Comparison post hoc test.
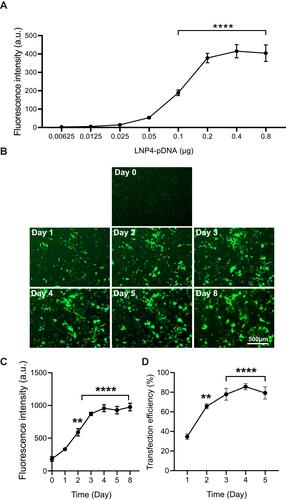
Figure 6 LNP4 induces GFP expression in the heart. (A) Outline of the experimental protocol. C57BL/6 mice were intravenously injected with either PBS (control) or LNP4 formulation (10 μg pDNA total). (B) Left: Representative images of GFP fluorescence in the heart of mice treated with either control or LNP4 formulation. (B) Right: Fluorescence quantification showed GFP expression in the heart tissue. Data are plotted as mean ± SEM. **p<0.01 by t-test.
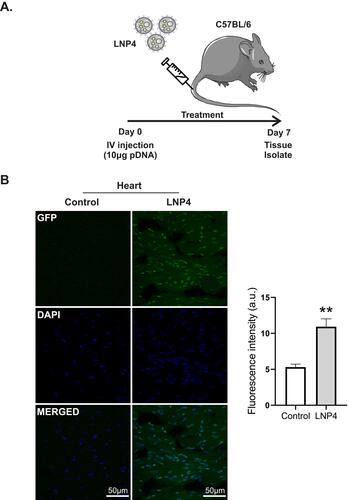
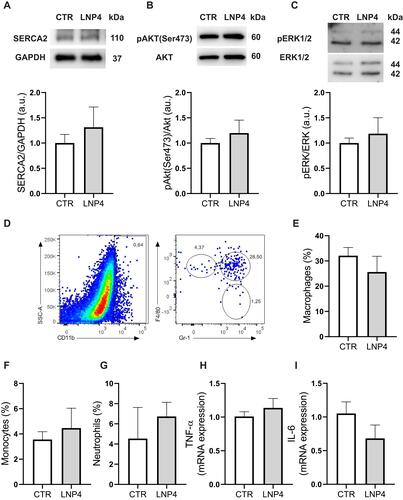
Figure 7 LNP4 does not trigger inflammation or dysfunction in the heart tissue. (A-C) Top: representative Western blot. Bottom: bar graph showing no changes in SERCA2, AKT phosphorylation at Ser473 and pERK1/2 respectively. GAPDH, AKT, or ERK1/2 total expression was used as a loading control. (D) Gating strategy to define CD11b+ myeloid population and dot plots to define monocytes (F4/80loGr-1−), macrophages (F4/80+Gr-1+), and neutrophils (F4/80−Gr-1+). Frequencies of (E) macrophages, (F) monocytes, and (G) neutrophils. (H) Levels of TNF-a, and (I) IL-6 mRNA expression normalized to 1. Data are plotted as mean ± SEM. Unpaired t-test was used when data fit a Gaussian distribution to unpaired samples.