Figures & data
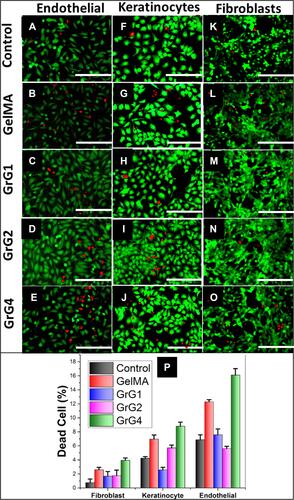
Figure 4 (A–E) Cell viability (Live/Dead assay) on Endothelial cells, (F–J) 3T3 fibroblast cells and (K–O) HaCat keratinocyte cells for control, blank GelMA hydrogel, 0.001 wt% rGO loaded GelMA hydrogel (GrG1), 0.002 wt% rGO loaded GelMA hydrogel (GrG2) and 0.004 wt% rGO loaded GelMA hydrogel (GrG4) respectively. Green channel depicts live cells, while red channels depict dead cells. (P) Quantitative comparison of the percentage of dead cells. The scale bar at the right lower corner is 1000 μm.