Figures & data
Figure 1 Characterization of TDMVs, MNP-Gd and TDMVs+MNP-Gd. (A) UV-vis-NIR absorption spectrum of the TDMVs, MNP-Gd and TDMVs+MNP-Gd solution. (B) DLS results of TDMVs, MNP-Gd and TDMVs+MNP-Gd dispersed in PBS. (C) Zeta potential of TDMVs, MNP-Gd and TDMVs+MNP-Gd dispersed in PBS. (D) TEM images of TDMVs and TDMVs+MNP-Gd.
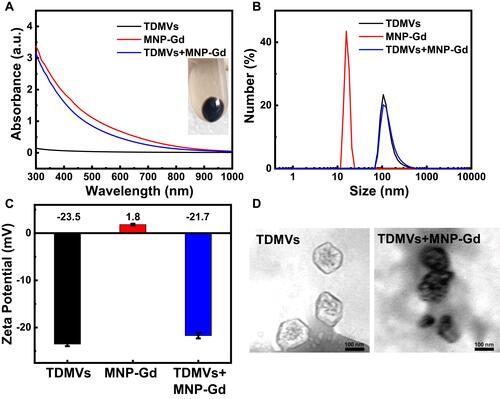
Figure 2 In vitro PA and MR imaging studies of TDMVs+MNP-Gd. (A) PA images of TDMVs+MNP-Gd at various concentrations (25, 50, 100, 200 and 400 μg/mL). (B) T1-weighted MR images and relaxivity measurements of TDMVs+MNP-Gd with different Gd3+concentrations (0.05, 0.1, 0.2, 0.4 and 0.6 mM). The T1 relaxation rate as a function of Gd3+ concentrations.
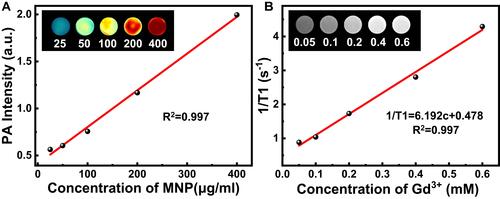
Figure 3 In vivo PA and MR imaging studies of TDMVs+MNP-Gd. (A) PA images in the tumor region collected by using the MOST imaging system before (pre) and at various time points after injection of TDMVs+MNP-Gd. (B) T1-Weighted MR axial images of tumor-bearing mice before (pre) and at various time points after injection of TDMVs+MNP-Gd using 3.0 T clinical MRI equipment. The yellow circles point to the tumor sites.
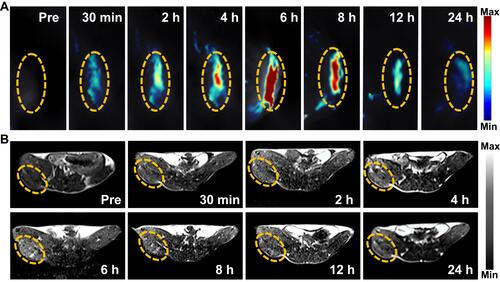
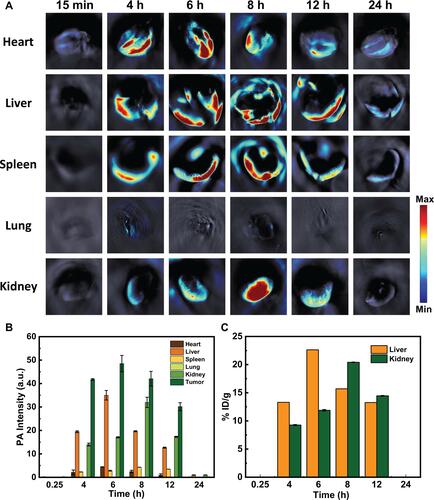
Figure 4 Biodistribution of the TDMVs+MNP-Gd. (A) Biodistribution of the TDMVs+MNP-Gd in main organs after i.v. injection into the tumor bearing mice using PA imaging at various time points. (B) PA signal intensities at various time points in tumors and the other organs. (C) Biodistribution of the TDMVs+MNP-Gd in liver and kidney after i.v. injection into the tumor bearing mice at various time points as determined by measuring Gd3+ concentrations in tissue lysates using ICP-MS.