Figures & data
Table 1 The Effect of the Independent Factors on the Characteristics of the GCLs
Table 2 Model Summary Statistics for the Influence of Formulations Variables on the Particle Size of the GCLs
Figure 1 Example of 3D response surface plot for the effect of formulation factors on the particle size of the prepared formulations, The Box Cox plot for the particle size model and the location of the selected formulations in the particle size model (for further evaluation): (A) 3D plot of GL1 through GL12, (B) 3D plot of GLG1 through GLG12, (C) Box Cox plot of GL1 through GL12, (D) Box Cox plot of GLG1 through GLG12 and (E) PS location of the selected formulations.
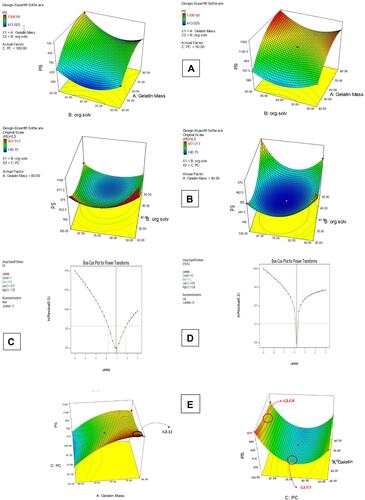
Figure 2 Transmission electron micrograph (TEM) of the selected formulations, (A) GLG1, (B) GLG4 and (C) GL12.
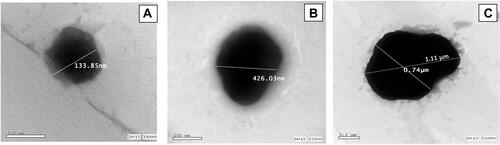
Figure 3 DSC thermogram of pure components namely; BRT, cholesterol, phosphatidylcholine and gelatin, their physical mixture and the lyophilized formulation; GLG1, GLG4 and GL12.
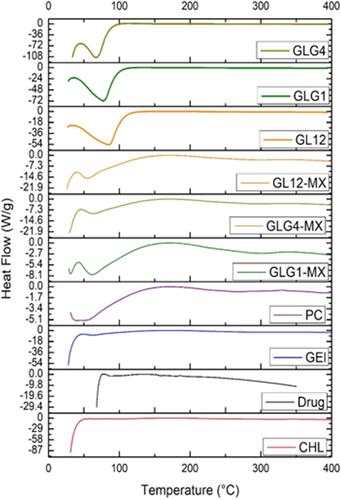
Figure 4 FTIR spectrums of pure BRT, cholesterol, phosphatidylcholine, gelatin, their physical mixture and the selected formulations; GLG1, GLG4 and GL12.
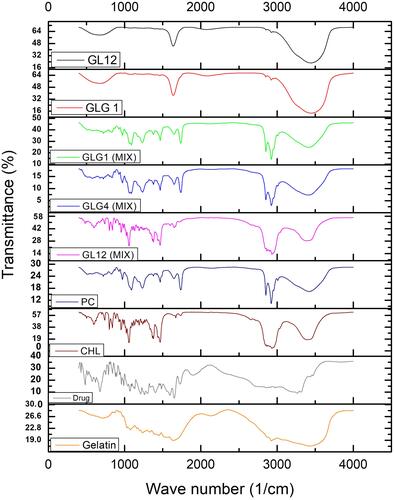
Figure 5 Percentage of BRT released from the selected GCLs; GLG1, GLG4 and GL12, versus the percentage diffused from drug solutions; 1, 2 and 3, each containing 10 mg of the drug and the equivalent amount of gelatin content of GLG1, GLG2 and GL12, respectively.
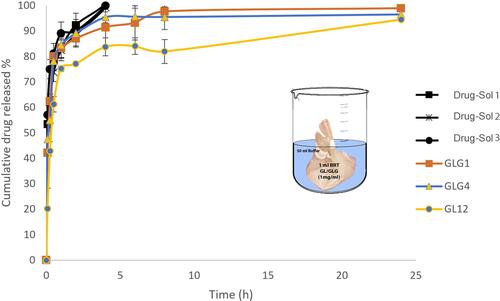
Figure 6 IOP lowering over 24 hours for the selected formulations compared to drug solution in isotonic buffer (DS) and control eye (C).
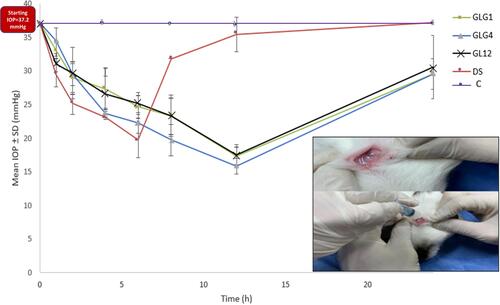
Table 3 Simplified Scoring System Based on the Draize’s Scale of Weighted Scores for Grading the Severity of Ocular Lesions
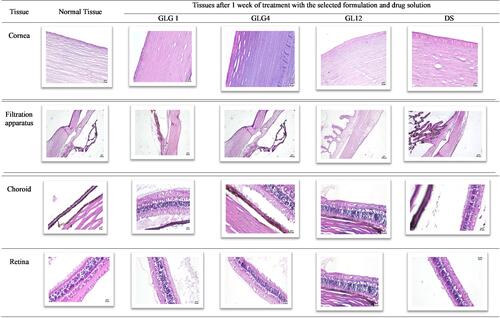
Figure 7 Histological examination of the rabbits’ eye-tissues after one week of treatment with the selected formulation and the drug solution; the control eye (untreated tissue), treated group with GLG1, treated group with GLG4, treated group with GL12 and treated group with drug solution (magnification is 10×).