Figures & data
Figure 1 Characterization of CS-SeNPs and SeNPs. The TEM (A) and SEM (B) micrographs of CS-SeNPs and SeNPs; (C) Elemental composition analysis of CS-SeNPs and SeNPs; (D) Size distribution of CS-SeNPs by DLS; (E) Zeta potentials of CS, SeNPs and CS-SeNPs.
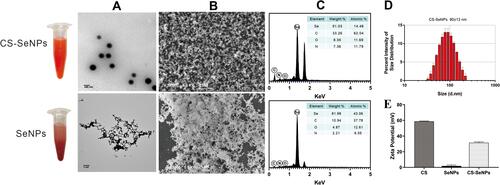
Figure 2 Cell viability of Marc-145 cells treated with different CS-SeNPs concentrations for 48 h using CCK-8 assay. Results are expressed as the mean ± SD of triplicate experiments.
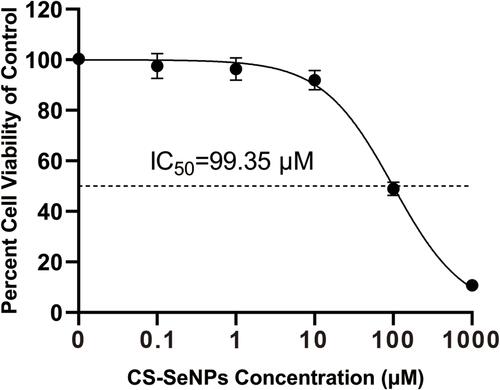
Figure 3 CS-SeNPs suppress oxidative stress induced by r-PRRSV-EGFP in Marc-145 cells. Effects of CS-SeNPs on H2O2 (A) and GSH (B) content and GSH-Px activity (C) in r-PRRSV-EGFP infected Marc-145 cells. All results are expressed as the mean ± SD of triplicate experiments. *P<0.05, **P <0.01 compared with mock, #P<0.05, ##P <0.01 compared with r-PRRSV-EGFP infected cells.
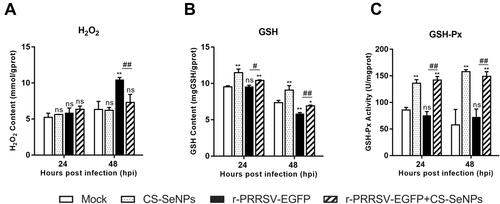
Figure 4 Identification of the inhibitory effect of CS-SeNPs on PRRSV replication in Marc-145 cells. (A) Relative r-PRRSV-EGFP ORF 5 mRNA levels determined by qRT-PCR in Marc-145 inoculated with r-PRRSV-EGFP at 0.1 MOI and treated with CS (1 mg/mL), Na2SeO3 (10 μM), and CS-SeNPs (10 μM) for 48 h. (B) Time-of-addition schematic. (C) Relative r-PRRSV-EGFP ORF 5 mRNA levels in Marc-145 inoculated with r-PRRSV-EGFP at 0.1 MOI and treated with CS-SeNPs (10 μM) according to the schematic. **P <0.01 compared with control group cells. (D) Relative ORF 5 mRNA levels determined by qRT-PCR. **P <0.01 compared with r-PRRSV-EGFP infected cells. (E) Viral titers detected by TCID50 of r-PRRSV-EGFP according to group VII treatment pattern in at the indicated times. Results are expressed as the mean ± SD of triplicate experiments, **P <0.01 compared with r-PRRSV-EGFP infected cells. (F) Marc-145 cells infected with r-PRRSV-EGFP at an MOI of 0.1 for 1 h and incubated with or without 10 μM CS-SeNPs for 48 h. Cells were fixed and stained with DAPI (4′,6-diamidino-2-phenylindole) and observed under fluorescence microscopy. Western blot analysis of PRRSV N protein in Marc-145 cells infected with r-PRRSV-EGFP (G) and ZJ-JX/2015 (H) and then incubated with or without 10 μM CS-SeNPs for 24 and 48 h. β-actin was used as the loading control.
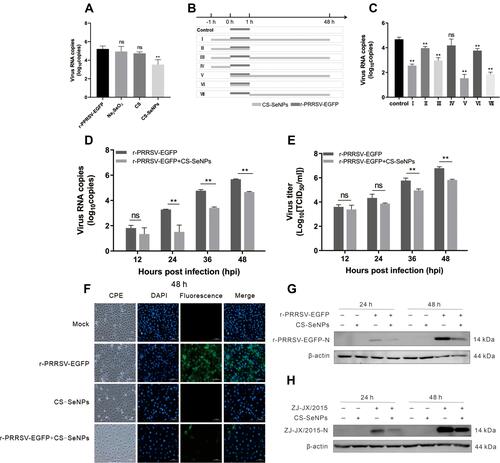
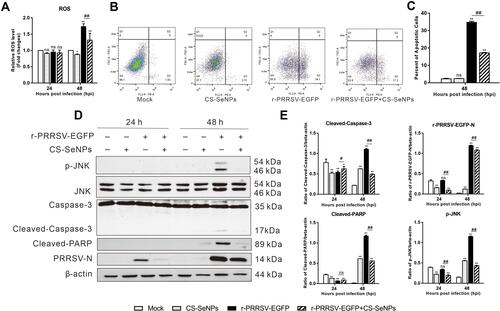
Figure 5 CS-SeNPs inhibit Marc-145 cell apoptosis caused by r-PRRSV-EGFP. Marc-145 cells were infected with r-PRRSV-EGFP (MOI= 0.1) for 1 h and then incubated with or without 10 μM CS-SeNPs for 24 or 48 h. (A) ROS levels were detected by DHE fluorescence intensity. (B) Flow cytometry analysis of apoptosis rate of Marc-145 cells stained with Annexin V-PE at 48 hpi. (C) Quantitative analysis of apoptotic cells expressed as the mean ± SD of triplicate experiments. (D) Protein expression of p-JNK, JNK, caspase-3, cleaved-caspase-3, cleaved-PARP, and PRRSV-N in Marc-145 cells were evaluated by Western blot at 24 and 48 hpi. β-actin was used as the loading control. (E) Protein expression was quantified by Western blot and expressed as fold change relative to β-actin. All results are represented as the means ± SD of triplicate experiments. *P<0.05, **P <0.01 compared with mock, #P<0.05, ##P <0.01 compared with r-PRRSV-EGFP infected cells.