Figures & data
Figure 1 General view of the synthesis of YF3 NPs and NP deposition on a surface by sonochemistry.
Notes: YF3 (black stars) is formed under ultrasonic irradiation (red waves). Microjets (blue arrows) are formed after the collapse of the acoustic bubble near the catheter wall and eject the NPs to create a YF3 NP coating.
Abbreviations: NP, nanoparticle; YF3, yttrium fluoride.
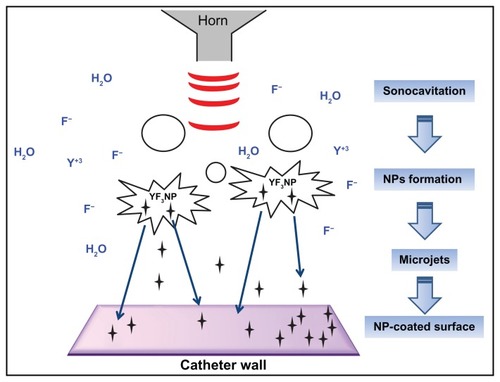
Figure 2 YF3 NP characterization. (A) SEM micrograph and (B) X-ray elemental spectra of YF3 NPs. Percentages indicated in (B) refer to the relative atomic ratio between fluor and yttrium atoms. (C and D) Nanoparticle length and width distributions.
Abbreviations: NP, nanoparticle; SEM, scanning electron microscope; YF3, yttrium fluoride.
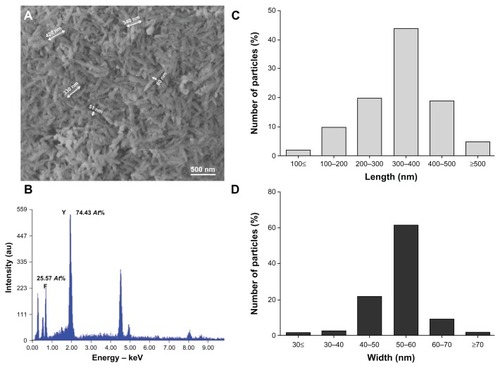
Figure 3 YF3 NP crystallinity characterization. (A) Powder XRD analysis of the crystalline NPs. The XRD pattern matched the reflection peaks and relative Miller indices of orthorhombic YF3. (B) HR-TEM micrographs of YF3 NPs and (C) characteristic lattice fringes of the crystalline phases indicated by the black arrow in (B). (D) Selected area diffraction patterns of polycrystalline YF3 NPs shown in (B).
Abbreviations: HR-TEM, high-resolution transmission microscope; NP, nanoparticle; XRD, X-ray diffraction; YF3, yttrium fluoride.
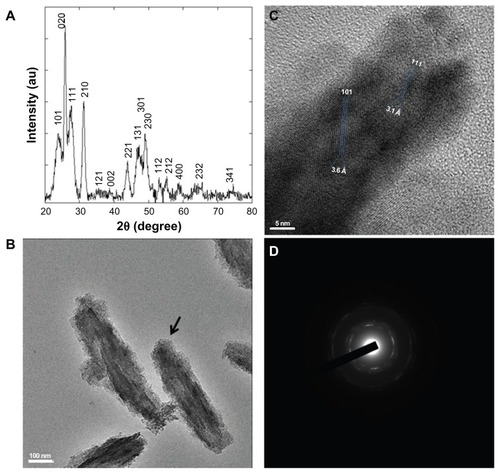
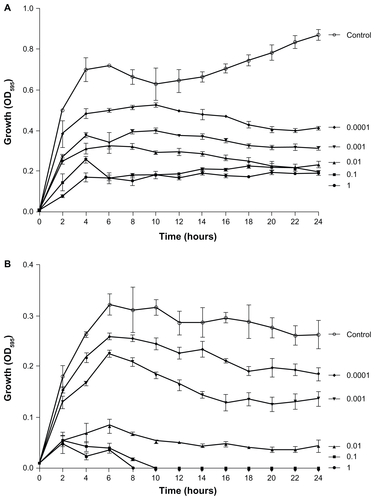
Figure 4 Antimicrobial effect of YF3 NPs. Growth curves of (A) Escherichia coli and (B) Staphylococcus aureus exposed to variable concentrations (0.0001 to 1 mg/mL) of YF3 NP solutions for 24 hours at 37°C.
Notes: Untreated bacteria served as a control. Error bars represent the standard deviation of three independent experiments conducted in triplicate. The results were found to be statistically significant (P < 0.05) between control versus NP-treated cells in all treatments.
Abbreviations: NP, nanoparticle; OD595, optical density at 595 nm; YF3, yttrium fluoride.
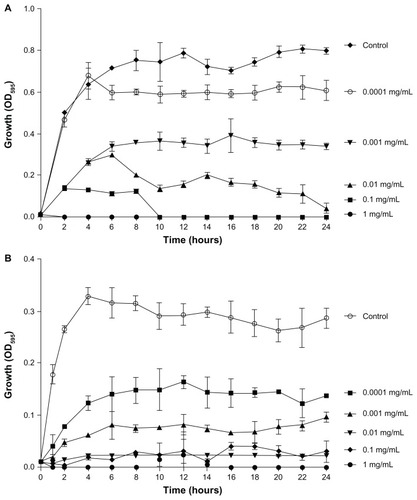
Figure 5 Influence of solubility of YF3 and MgF2 NPs on the F− intracellular and extracellular concentrations.
Notes: Fluorine intracellular ([F−]in, columns-left y axis) and extracellular (ie, fluorine concentration in the surrounding media, noted at [F−]ex and represented by circles-right y axis) concentrations of Escherichia coli and Staphylococcus aureus exposed to MgF2 and YF3 NPs at a concentration of 0.01 mg/mL for 2 hours at 37°C. Error bars represent the standard deviation of three independent experiments conducted in triplicate. Each circle represents the mean of one experiment conducted in triplicate. (Insert) The MICs of E. coli and S. aureus exposed, respectively, to MgF2 and YF3 NPs (taken from and S2).
Abbreviations: [F−]ex, fluorine extracellular concentration; [F−]in, fluorine intracellular concentration; MgF2, magnesium fluoride; MICs, minimal inhibitory concentrations; NPs, nanoparticles; YF3, yttrium fluoride.
![Figure 5 Influence of solubility of YF3 and MgF2 NPs on the F− intracellular and extracellular concentrations.Notes: Fluorine intracellular ([F−]in, columns-left y axis) and extracellular (ie, fluorine concentration in the surrounding media, noted at [F−]ex and represented by circles-right y axis) concentrations of Escherichia coli and Staphylococcus aureus exposed to MgF2 and YF3 NPs at a concentration of 0.01 mg/mL for 2 hours at 37°C. Error bars represent the standard deviation of three independent experiments conducted in triplicate. Each circle represents the mean of one experiment conducted in triplicate. (Insert) The MICs of E. coli and S. aureus exposed, respectively, to MgF2 and YF3 NPs (taken from Figures 4 and S2).Abbreviations: [F−]ex, fluorine extracellular concentration; [F−]in, fluorine intracellular concentration; MgF2, magnesium fluoride; MICs, minimal inhibitory concentrations; NPs, nanoparticles; YF3, yttrium fluoride.](/cms/asset/d4e619cf-3fba-49a4-919c-7e875725401e/dijn_a_37075_f0005_b.jpg)
Figure 6 Antibiofilm properties of YF3 NPs.
Notes: Biofilm formation quantified after overnight incubation for (A) Escherichia coli and (B) Staphylococcus aureus exposed to variable concentrations (0.0001 to 1 mg/mL) of YF3 NP solutions for 24 hours at 37°C.
Notes: Untreated bacteria served as a control. Error bars represent the standard deviation of three independent experiments. The results were found to be statistically significant (P < 0.05) between control versus NP-treated cells in all treatments.
Abbreviations: NP, nanoparticle; OD595, optical density at 595 nm; YF3, yttrium fluoride.
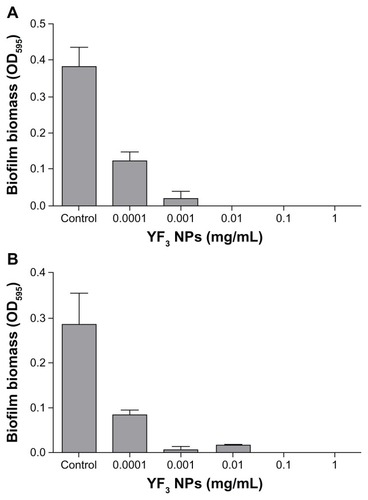
Table 1 Characterization of YF3 particles of different size
Figure 7 Impact of size of YF3 NPs on antimicrobial activity.
Notes: Growth yields of Escherichia coli and Staphylococcus aureus grown in the presence of YF3 NP (0.001 mg/mL) suspension at different sizes (samples 1–3) for 24 hours at 37°C. Untreated bacteria served as a control. Error bars represent the standard deviation of three independent experiments. The results were found to be statistically significant (P < 0.05) between control versus NP-treated cells in all treatments.
Abbreviations: NP, nanoparticle; OD595, optical density at 595 nm; YF3, yttrium fluoride.
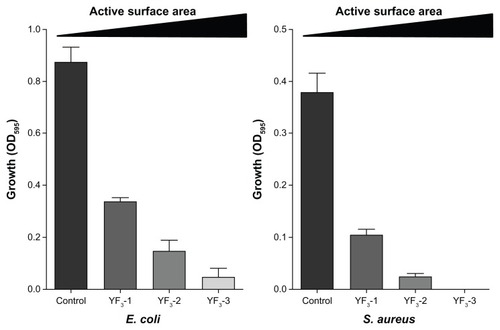
Figure 8 Imaging and characterization of sonochemical YF3 NP catheter coating.
Notes: Catheters were coated using a sonochemical procedure described in the experimental section. SEM images of the internal walls of uncoated and YF3 NP-coated catheters are presented. The distribution of the YF3 NP coating on the catheter’s surface characterized by X-ray dot mapping of yttrium (red) and fluor (purple) atoms signals detected on the internal catheter wall.
Abbreviations: K, K line energy; NP, nanoparticle; SEM, scanning electron microscope; YF3, yttrium fluoride.
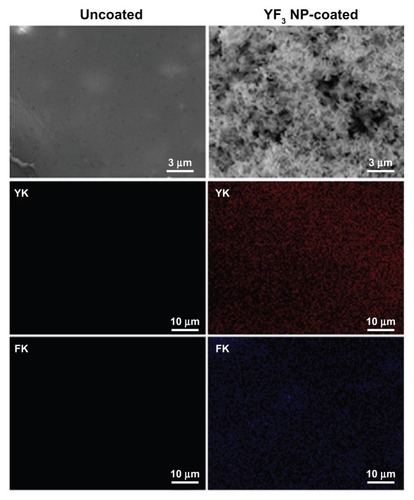
Figure 9 Antibiofilm properties of the catheter coated with YF3 NPs against formation of biofilms by Escherichia coli and Staphylococcus aureus.
Notes: Viable counts of the biofilm cells of E. coli and S. aureus, grown in TSB and TSB-Glu, on the internal wall of a YF3 NP-coated catheter incubated for 24 hours at 37°C. Uncoated catheters served as the negative control. Bars represent the standard deviation of three independent experiments conducted in triplicate. The results were found to be statistically significant (P < 0.05) between uncoated versus NP-coated catheters in all treatments.
Abbreviations: CFU, colony forming units; NP, nanoparticle; TSB, tryptic soy broth; TSB-Glu, tryptic soy broth supplemented with 0.2% glucose; YF3, yttrium fluoride.
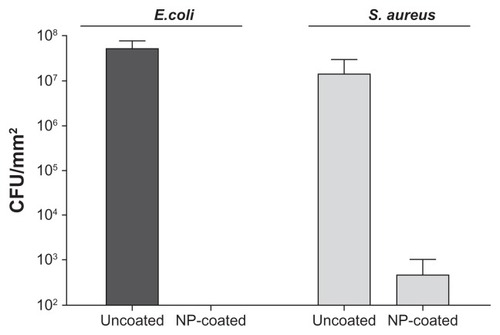
Figure S1 Growth curves (A) and biofilm formation (B) of Escherichia coli and Staphylococcus aureus exposed to fluorine (100 μg/mL) and yttrium ions (100 μg/mL) for 24 hours at 37°C.
Notes: Untreated bacteria served as a control. Error bars represent the standard deviation of three independent experiments conducted in triplicate.
Abbreviation: OD595, optical density at 595 nm.
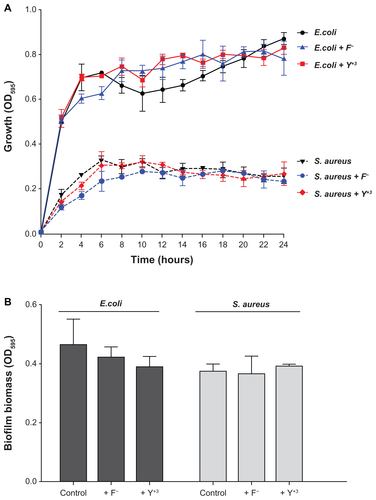
Figure S2 Antimicrobial effect of MgF2 NPs. Growth curves of (A) Escherichia coli and (B) Staphylococcus aureus exposed to variable concentrations (0.0001 to 1 mg/mL) of MgF2 NP solutions for 24 hours at 37°C.
Notes: Untreated bacteria served as a control. Error bars represent the standard deviation of three independent experiments conducted in triplicate.
Abbreviations: MgF2, magnesium fluoride; OD595, optical density at 595 nm; NPs, nanoparticles.