Figures & data
Figure 1 A schematic representation of nanodiamond types based on their methods of synthesis and applications.
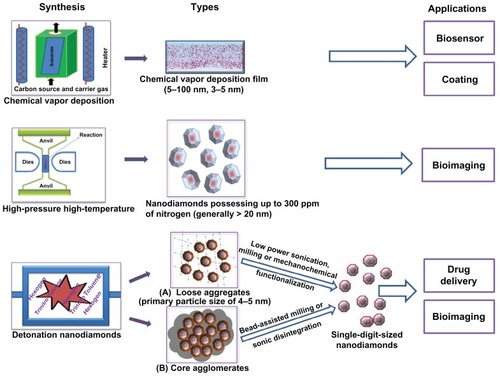
Figure 2 Scanning electron microscopic image of (A) nanocrystallineCitation4 and (B) ultrananocrystallineCitation10 diamond films grown on silicon substrate.
A is reprinted with permission from: Philip J, Hess P, Feygelson T, et al. Elastic, mechanical, and thermal properties of nanocrystalline diamond films. J Appl Phys. 2003;93(4):2164–2171,Citation4 Copyright (2003), American Institute of Physics. B is reprinted with permission from: Sumant AV, Grierson DS, Gerbi JE, Carlisle JA, Auciello O, Carpick RW. Surface chemistry and bonding configuration of ultrananocrystalline diamond surfaces and their effects on nanotribological properties. Phys Rev B Condens Matter Mater Phys. 2007;76(23):235429-1–235429-11,Citation10 Copyright (2007) by the American Physical Society.
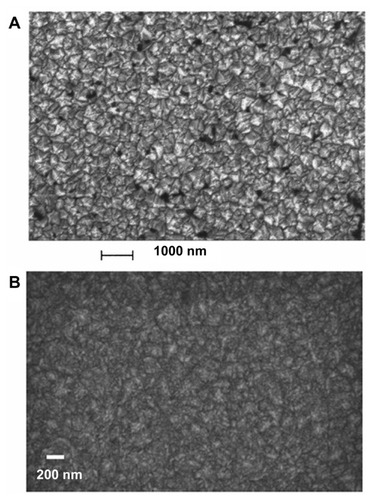
Figure 3 Phase diagram for carbon depicting the pressure and temperature requirements for synthesis of detonation nanodiamond (1); cooling profile of products produced by wet detonation synthesis (2) and dry detonation synthesis (3).Citation29
Notes: “TD” represents Debye temperature.
Reproduced courtesy of IOP Publishing Ltd, from: Baidakova M, Vul A. New prospects and frontiers of nanodiamond clusters. J Phys D Appl Phys. 2007;40(20):6300–6311.
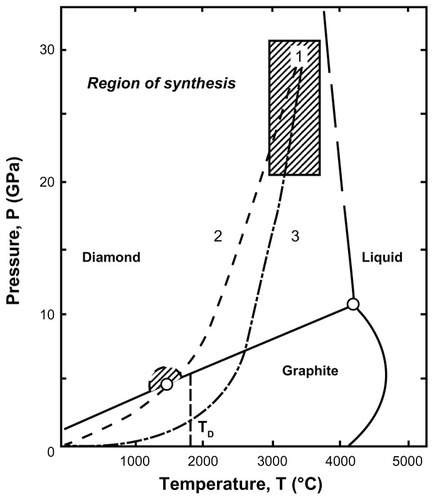
Figure 4 High-resolution transmission electron microscopic image of detonation nanodiamonds.
Note: Image is courtesy of Bogdan Palosz, IHPP, Warsaw, Poland.
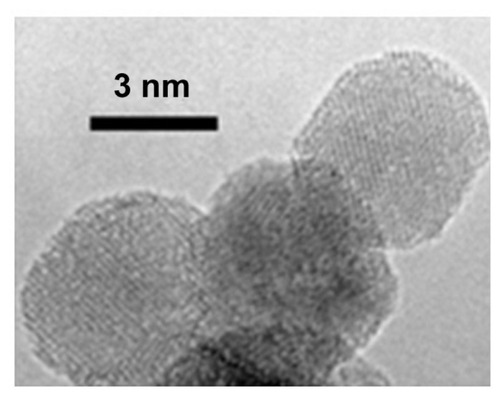
Figure 5 A schematic representation of approaches used for modification of nanodiamond surfaces.
Abbreviations: R.T., room temperature; R, alkyl group; Ar, aromatic group; THF, tetrahydrofuran; DMAP, (dimethylamino)pyridine; EDC, (1-ethyl-3-[(3-dimethylamino)propyl]carbodiimidehydrochloride).
![Figure 5 A schematic representation of approaches used for modification of nanodiamond surfaces.Abbreviations: R.T., room temperature; R, alkyl group; Ar, aromatic group; THF, tetrahydrofuran; DMAP, (dimethylamino)pyridine; EDC, (1-ethyl-3-[(3-dimethylamino)propyl]carbodiimidehydrochloride).](/cms/asset/2934650a-c46f-49fb-8e58-0a639da34b0a/dijn_a_37348_f0005_c.jpg)
Figure 6 A schematic representation of the applications of the nanodiamonds.
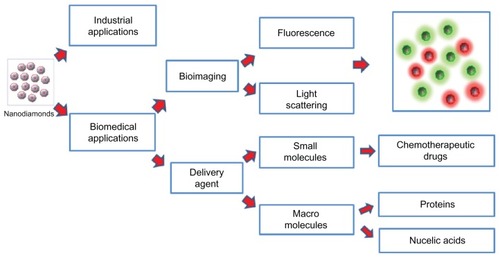
Figure 7 A schematic diagram representing the binding of detonation nanodiamonds with (A) small molecules,Citation72,Citation73 (B) proteins,Citation73 (C) plasmid DNA,Citation66,Citation109 and (D) siRNA.Citation110
©2012 Dove Medical Press. Adapted with permission from Kaur R, Chitanda JM, Michel D, et al. Lysine-functionalized nanodiamonds: synthesis, physiochemical characterization, and nucleic acid binding studies. Int J Nanomedicine. 2012;7:3851–3866.
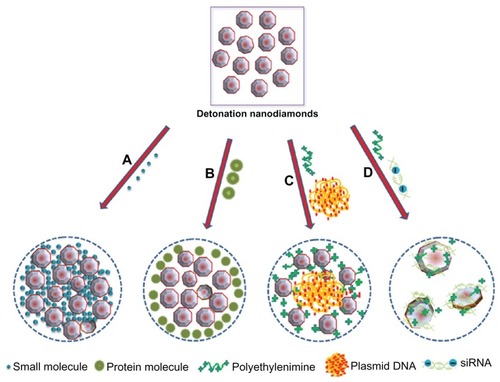
Table 1 Highlights of the unique fluorescence properties of nanodiamonds
Figure 8 Overlay image (far right) demonstrating the wrapping of TOTO-1 dye-labeled T4DNA (green color, V-shape) around the surface of a single polyL-lysine-coated fluorescent nanodiamond (red color).
Reprinted with permission from: Fu CC, Lee HY, Chen K, et al. Characterization and application of single fluorescent nanodiamonds as cellular biomarkers. Proc Natl Acad Sci U S A. 2007;104(3):727–732.Citation25 Copyright (2007) National Academy of Sciences, USA.
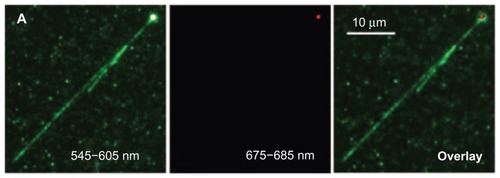
Figure 9 Images of a single HeLa cell treated with ND-transferrin complex: (A) bright-field image, (B) confocal scanning image obtained by collecting all the fluorescence emissions above a wavelength of 550 nm, and (C) confocal scanning image obtained by collecting only the fluorescence emissions at wavelengths of 663–738 nm.
Note: A 514.5 nm laser was used as excitation source.
Reprinted from: Weng MF, Chiang SY, Wang NS, Niu H. Fluorescent nanodiamonds for specifically targeted bioimaging: application to the interaction of transferrin with transferrin receptor. Diam Relat Mater. 2009;18(2–3):587–591.Citation126 Copyright (2008), with permission from Elsevier.
Abbreviation: ND, nanodiamonds.
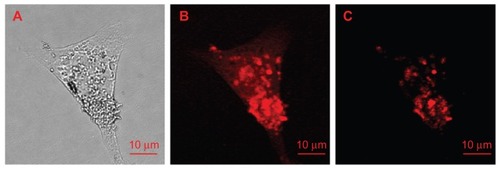
Figure 10 (I) Images of Caenorhabditis elegans: (A) an untreated worm with labeled organ morphology; worms after oral administration of bare nanodiamonds (NDs) for (B) 2 hours and (C) 12 hours; worms fed with bare NDs for 2 hours with subsequent administration of Escherichia coli for (D) 20 minutes (E) and 40 minutes. (B–E) upper show epifluorescence images; lower show epifluorescence and differential interference contrast merged images. (II) Epifluorescence and differential interference contrast merged images of Caenorhabditis elegans: worms after oral administration of (A) dextran-conjugated NDs, (B) bovine serum albumin-conjugated NDs, and worms exposed to Escherichia Coli after administration of (C) dextran-conjugated NDs and (D) bovine serum albumin-conjugated NDs.
Notes: Blue arrows indicate internalization of NDs in intestinal cells; yellow arrow indicate localization of NDs in lumen of worm.
Reprinted with permission from: Mohan N, Chen CS, Hsieh HH, Wu YC, Chang HC. In vivo imaging and toxicity assessments of fluorescent nanodiamonds in Caenorhabditis elegans. Nano Lett. 2010;10(9):3692–3699.Citation142 Copyright (2010) American Chemical Society.
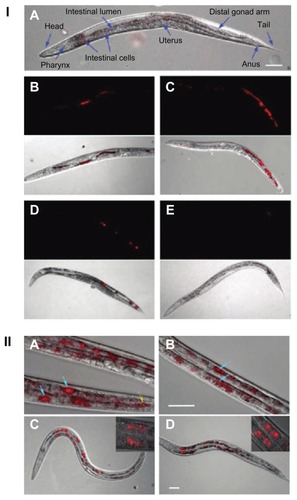
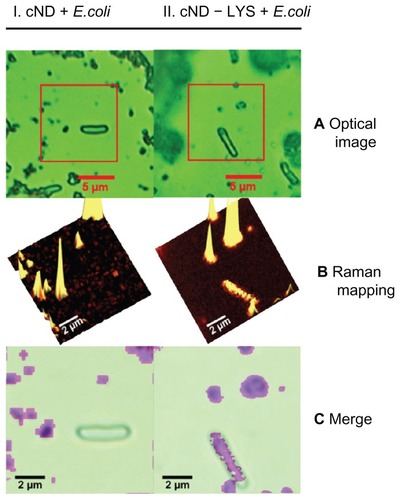
Figure 11 Lysozymal interaction sites revealed with Escherichia coli: (I) carboxylated nanodiamonds (NDs) and Escherichia coli, (II) carboxylated ND-lysozyme complex and Escherichia coli. (A) Optical images identifying Escherichia coli; (B) confocal Raman mapping identifying NDs present in the square area outlined in optical image; (C) merging of the optical image with Raman mapping, demonstrating the interaction of the lysozymes with Escherichia coli.Citation145
Reproduced from: Perevedentseva E, Cheng CY, Chung PH, Tu JS, Hsieh YH, Cheng CL. The interaction of the protein lysozyme with bacteria E. coli observed using nanodiamond labelling. Nanotechnology. 2007;18(31):315102,Citation145 courtesy of IOP Publishing Ltd.