Figures & data
Figure 1 (A–D) Digital photograph of Gt, GtO, GO, and rGO at a concentration of 600 μg/mL. Gt, GtO, GO, and rGO were prepared as described in the Materials and methods section. Gt dispersion was obtained after sonication for 1 hour (A). The GtO dispersion was obtained by the oxidation of Gt, and it is opaque yellow in color (B). GO nanosheets were exfoliated from the GtO, resulting in the clearest and homogeneous yellow-brown GO dispersion (C). rGO was obtained from the reaction of BME with graphene oxide, resulting in the homogeneous dark color (D).
Abbreviations: Gt, graphite; GtO, graphite oxide; GO, graphene oxide; rGO, reduced graphene oxide; BME, betamercaptoethanol.
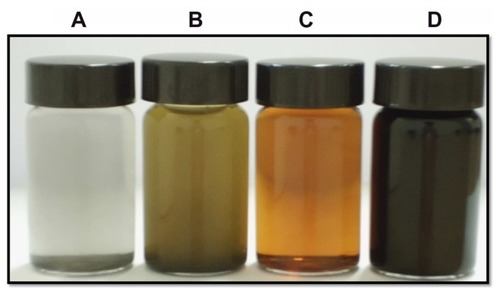
Figure 2 Ultraviolet-visible (UV-Vis) spectra of GO and rGO showing the restoration of electronic conjugation in the rGO.
Notes: The reduction was measured by UV-Vis spectroscopy at ambient temperature by using a UV-Vis spectrophotometer. GO shows two absorption peaks: one at ~230 nm and another shoulder at ~300 nm. After reduction by BME, the peak at 230 nm shifted to 260 nm.
Abbreviations: GO, graphene oxide; rGO, reduced graphene oxide; BME, betamercaptoethanol.
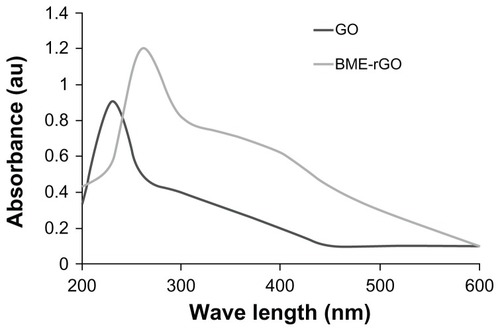
Figure 3 (A and B) X-ray diffraction (XRD) pattern of GO and rGO. In the XRD pattern of GO, the strong and sharp peak at 2θ = 11.7° corresponds to an interlayer distance of 7.6 Å (d002) (A). rGO shows two peaks: one small peak centered at 2θ = 11.7° and another broad peak at 2θ = 25.8°, corresponding to interlayer distances of 4.47 and 3.53 Å, respectively (B).
Note: These XRD results are related to the exfoliation and reduction processes of GO and the processes of removing intercalated water molecules and the oxide groups.
Abbreviations: GO, graphene oxide; rGO, reduced graphene oxide.
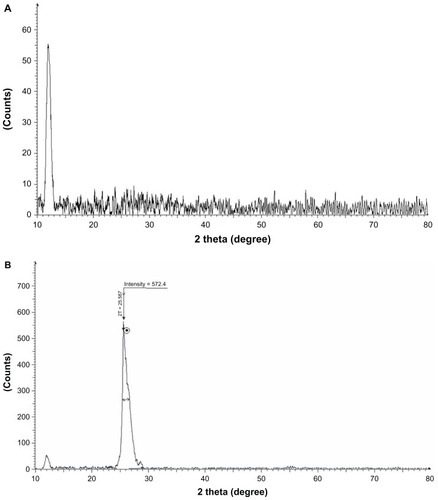
Figure 4 (A and B) Dynamic light-scattering (DLS) spectra of GO and rGO dispersions. At least 200 particles were measured for each sample to obtain the size distribution. The GO (A) and rGO (B) sizes were measured by a Zetasizer Nano ZS90 with a scattering angle θ = 90°.
Notes: The standard spherical particle models were used in DLS. DLS results provide a quick indication of their different solubility.
Abbreviations: GO, graphene oxide; rGO, reduced graphene oxide.
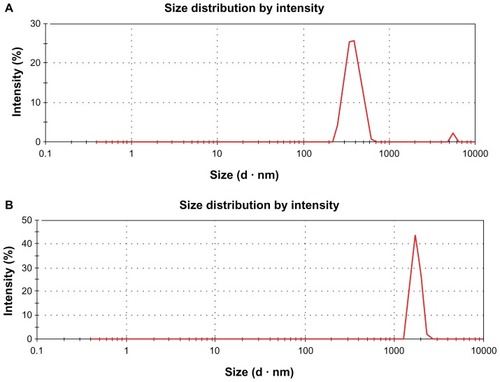
Figure 5 (A and B) Scanning electron microscopy images of GO and rGO. 0.1 mg/mL of GO and rGO was dispersed in aluminum foil and dried, and then images were taken using scanning electron microscopy. GO sheets are smooth with small wrinkles and folded at the edges (A), and reduced GO material consists of stacked and aggregated, thin, crumpled sheets (B).
Abbreviations: GO, graphene oxide; rGO, reduced graphene oxide.
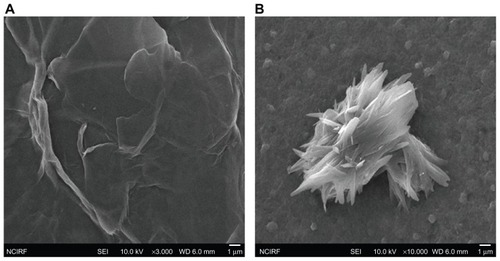
Figure 6 (A and B) Raman spectra of GO and rGO. The G-band and D-band of GO appear at 1595 cm−1 and 1347 cm−1, respectively (A). In the Raman spectrum of GO after the reduction by BME, (B) the D-band is broadened and shifted to around 1342 cm−1 and G band shifted to 1603 cm−1.
Note: rGO after reduction by BME shows a higher D/G intensity ratio than GO.
Abbreviations: GO, graphene oxide; rGO, reduced graphene oxide; BME, betamercaptoethanol.
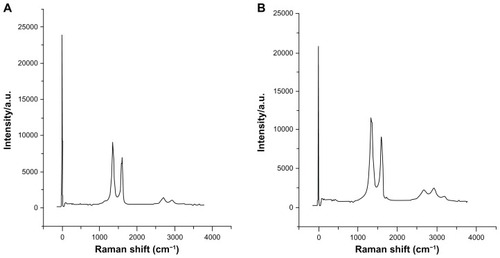
Figure 7 Effect of various graphene materials (Gt, GtO, GO, and rGO) on growth of Pseudomonas aeruginosa.
Notes: Cells were incubated with Gt, GtO, GO, and rGO (75 μg/mL) separately. Samples were withdrawn at different time points of growth, and cells were centrifuged, washed with distilled water, and analyzed for growth at 600 nm. Data are averages from triplicate experiments. Error bars represent standard deviations of triplicate incubations. The results represent the means of three separate experiments, and error bars represent the standard error of the mean. Treated groups showed statistically significant differences from the control group by Student’s t-test (P < 0.05).
Abbreviations: Gt, graphite; GtO, graphite oxide; GO, graphene oxide; rGO, reduced graphene oxide.
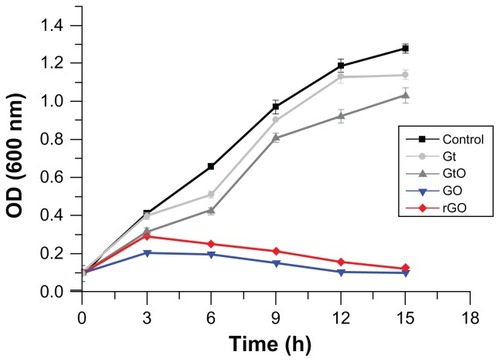
Figure 8 Effect of concentration-dependent GO and rGO in Pseudomonas aeruginosa cell viability.
Notes: Cells were incubated at 37°C with various concentrations of GO and rGO separately for 2 hours at 200 rpm shaking speed. Cell-viability rates were determined by the colony-counting method and expressed as a percentage of control. The results represent the means of three separate experiments, and error bars represent the standard error of the mean. Treated groups showed statistically significant differences from the control group by Student’s t-test (P < 0.05).
Abbreviations: GO, graphene oxide; rGO, reduced graphene oxide.
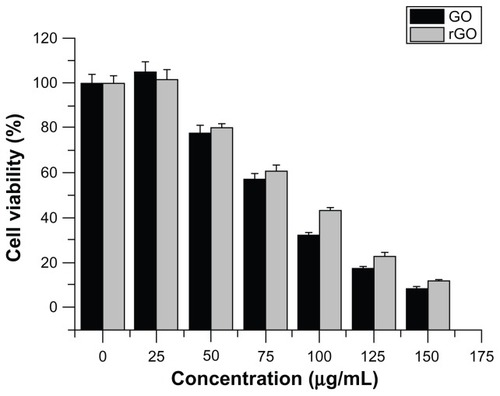
Figure 9 Time-dependent antibacterial activities of GO and rGO.
Notes:Pseudomonas aeruginosa (106–107 colony forming units/mL) cells were treated with GO or rGO (100 μg/mL) at 37°C for 4 hours at 200 rpm shaking speed. Cell-viability rates were determined by the colony-counting method and expressed as a percentage of control. The results represent the means of three separate experiments, and error bars represent the standard error of the mean. Treated groups showed statistically significant differences from the control group by Student’s t-test (P < 0.05).
Abbreviations: GO, graphene oxide; rGO, reduced graphene oxide.
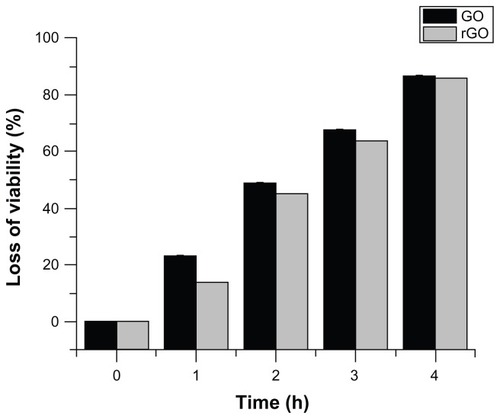
Figure 10 Effect of GO and rGO on ROS generation in Pseudomonas aeruginosa.
Notes: ROS generation was measured by nitro blue tetrazolium (NBT) assay. Cells were treated separately with GO and rGO (100 μg/mL) for 2 hours. Cells were pretreated with NAC and GSH to a final concentration of 1 mM. NBT reduction was stopped by adding acetic acid to the incubation medium. Reduced NBT was dissolved in dimethyl sulfoxide, and the absorbance was determined at 560 nm. The results represent the means of three separate experiments, and error bars represent the standard error of the mean. Treated groups showed statistically significant differences from the control group by Student’s t-test (P < 0.05). Positive control for ROS generation was obtained by the addition of H2O2 to a final concentration of 3 mM.
Abbreviations: GO, graphene oxide; rGO, reduced graphene oxide; ROS, reactive oxygen species; NBT, nitro blue tetrazolium; NAC, N-acetylcysteine; GSH, glutathione.
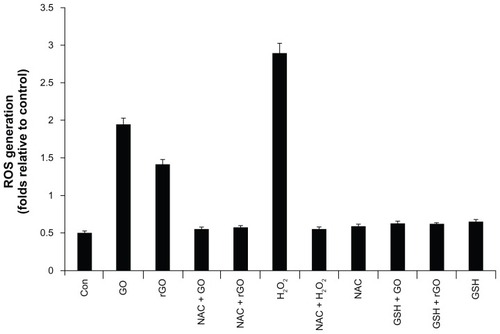
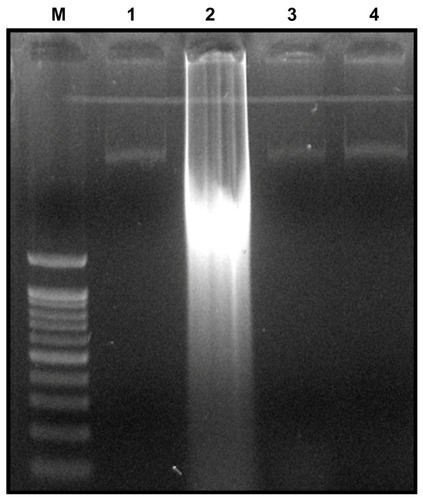
Figure 11 Detection of GO and rGO induced apoptosis by cellular DNA fragmentation.
Notes: For DNA fragmentation, cells were incubated with GO and rGO (100 μg/mL) for 24 hours. After incubation, DNA extracted from cells and resolved on agarose gel electrophoresis. Lane M, 1 kB ladder; lane 1, control; lane 2, GO; lane 3, rGO; lane 4, silver nanoparticles.
Abbreviations: GO, graphene oxide; rGO, reduced graphene oxide.