Figures & data
Figure 1 Schematic representation of the ventricular myocardial band (A–E) for consecutive stages of unwinding. The myocardial band can be divided into four segments (E): RV free wall (RFW, black), LV free wall (LFW, dark gray), descending segment (DS, white), and ascending segment (AS, light gray). The myocardial band extends between the pulmonary artery (PA) and the aorta (Ao). These segments spatially conform to two loops: the basal loop (from A to B), constituted by RFW (black) and LFW (dark gray), and the apical loop (from B to C) formed by the descending segment (DS, white) and the ascending segment (AS, light gray).
Note: Arrows indicate the cleavage plane that provides clues for unwinding the myocardial band.
Abbreviations: apm, anterior papillary muscle; LFW, left ventricular free wall; lt, left trigone of the aorta; ppm, posterior papillary muscle; RFW, right ventricular free wall; rt, right trigone of the aorta; RV, right.
Reprinted from J Thorac Cardiovasc Surg. Torrent-Guasp F, Ballester M, Buckberg GD, et al. Spatial orientation of the ventricular muscle band: physiologic contribution and surgical implications. 122:389–392. Copyright (2001) with permission from Elsevier.Citation20
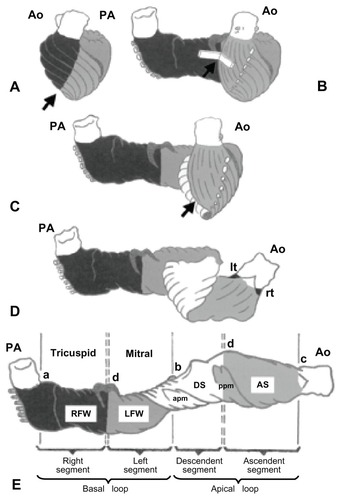
Table 1 Different treatment modalities and their advantages and drawbacks
Figure 2 Immunocytochemical analysis for the expression of cardiac marker protein α-actinin (A–C), β-myosin heavy chain (D–F), troponin (G–I), connexin 43 (J–L) on tricalcium phosphate (A, D, G and J) and fibrinogen nanofibers (B, E, H and K) and poly(glycerol sebacate)/fibrinogen core/shell fibers (C, F, I and L) at 60× magnification.
Note: Nucleus stained with DAPI (4′,6-diamidino-2-phenylindole).
Reprinted from Int J Cardiol. Ravichandran R, Venugopal JR, Sundarrajan S, Mukherjee S, Sridhar R, Ramakrishna S. Expression of cardiac proteins in neonatal cardiomyocytes on PGS/fibrinogen core/shell substrate for cardiac tissue engineering. Copyright 2012, with permission from Elsevier.Citation47
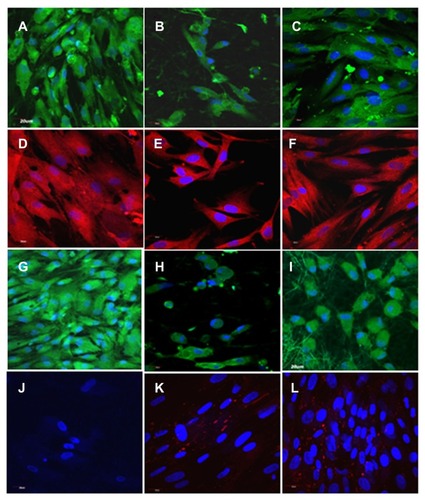
Figure 3 (A) The homogeneous mixture of poly(glycerol sebacate) (PGS) fibers suspended in phosphate-buffered saline solution after stirring for 2 hours with a magnetic stirrer at 37°C. (B) The PGS fibers loaded in a 1 mL syringe prepared for the injectable system. (C) The morphology of the PGS short fibers is retained after passing through the 18 G needle, at 40× magnification. (D) The morphology of the PGS short fibers after passing through the 18 G needle, at 60× magnification. Reprinted with permission Nanotechnology. Ravichandran R, Venugopal JR, Sundarrajan S, Mukherjee S, Sridhar R, Ramakrishna S. Minimally invasive injectable short nanofibers of poly(glycerol sebacate) for cardiac tissue engineering. Copyright 2012 IOP Publishing.Citation52
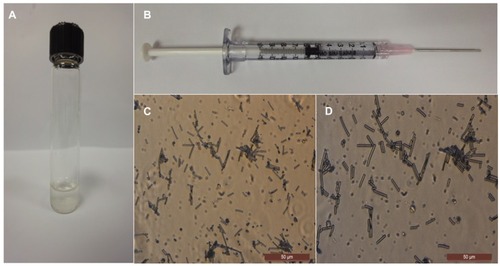
Figure 4 (A) An AV loop was constructed and placed into the tissue engineering chamber in the nude rat groin. (B) Cells (ASC–rCM or ASC or rCM) suspended in Matrigel™ were seeded around the AV loop.
Reprinted from Biomaterials. Choi YS, Matsuda K, Dusting GJ, Morrison WA, Dilley RJ. Engineering cardiac tissue in vivo from human adipose-derived stem cells. 31:2236–2242. Copyright 2010 with permission from Elsevier.Citation99
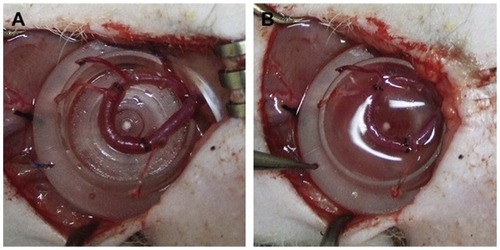
Figure 5 (A–D) Tracking of grafted cardiac stem cells (CSCs) by immunofluorescence. (A and B) CSCs within the recipient myocardium 3 days after injection shown at low and high magnification. (C and D) Transplanted CSCs can differentiate and integrate with host myocardium, as confirmed by green fluorescence protein (GFP) and α-sarcomeric actin (SA) double-staining. At day 14, CSCs could differentiate into cardiomyocytes, as confirmed by α-SA and GFP double-staining (C). However, this population became significantly decreased when the tissues were examined at day 28 (D), which is also consistent with the decrease in bioluminescence signals over this period. Scale bar = 100 μm (A), 20 μm (B–D).
Reprinted from J Am Coll Cardiol. Li Z, Lee A, Huang M, et al. Imaging survival and function of transplanted cardiac resident stem cells.53:1229–1240. Copyright 2009 with permission from Elsevier.Citation102
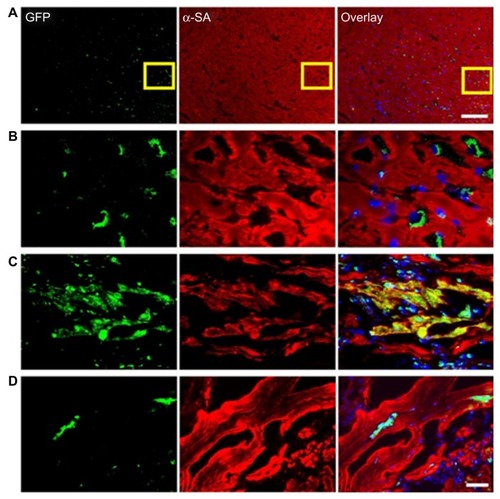
Figure 6 Dual immunocytochemical analysis for the expression of mesenchymal stem cell marker protein CD 105 (A, D and G) and cardiac marker protein actinin (B, E and H) in the coculture samples and the merged image showing the dual expression of both CD 105 and actinin (C, F and I); on the tricalcium phosphate (A–C) and gelatin nanofibers (D–F) and poly(glycerol sebacate)/gelatin core/shell fibers (G–I) at 60× magnification.
Note: Nucleus stained with DAPI (4′,6-diamidino-2-phenylindole). Reprinted with permission Tissue Eng Part A. Ravichandran R, Venugopal JR, Sundarrajan S, Mukherjee S, Ramakrishna S. Poly(glycerol sebacate)/gelatin core/shell fibrous structure for regeneration of myocardial infarction. Copyright 2011 Mary Ann Liebert Inc.Citation44
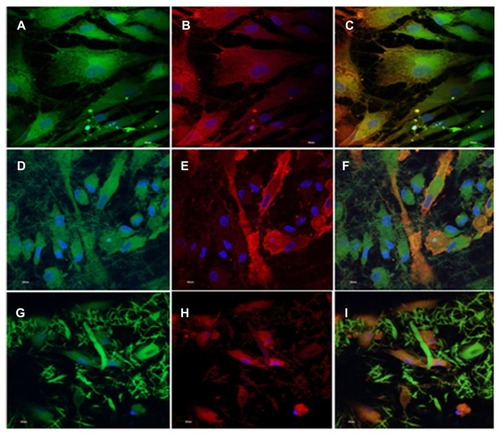
Table 2 Different types of cells used for cardiac tissue engineering and their advantages and drawbacks
Table 3 List of polymer biomaterials and their properties
Figure 7 (A–E) Histologic assessment 5 weeks after injection. Masson’s trichrome staining showed the collagen deposition (blue) in the infarcted areas of the phosphate-buffered saline- (PBS; A), fibrin- (B), and alginate- (C) injected groups. Black arrows indicate the existence of alginate. The infarcted percentage of the left ventricle (LV; D) and wall thickness (E) were measured.
Note: Scale bars = 1.0 mm. *represents P < 0.05.
Reprinted from J Thorac Cardiovasc Surg. Yu J, Christman KL, Chin E, Sievers RE, Saeed M, Lee RJ. Restoration of left ventricular geometry and improvement of left ventricular function in a rodent model of chronic ischemic cardiomyopathy.137:180–187. Copyright (2009) with permission from Elsevier.Citation179
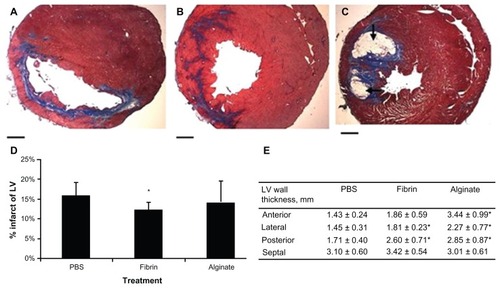
Table 4 Source of growth factors and functions