Figures & data
Figure 1 (A) Zeta potential variation as a function of layer number during the LbL process. The measurements were carried out at room temperature by suspending the particles in deionized water of pH 5.6. (B) SEM and (C) TEM images of CS-HP nanocapsules after core dissolution. (D) Size determined by dynamic light scattering.
Notes: EDS indicates the presence of silica, and inset SEM image shows the nanocapsule to have a rough surface indicative of deposition.
Abbreviations: CS, chitosan; EDS, energy-dispersive X-ray spectrometry; HP, heparin; SEM, scanning electron microscopy.
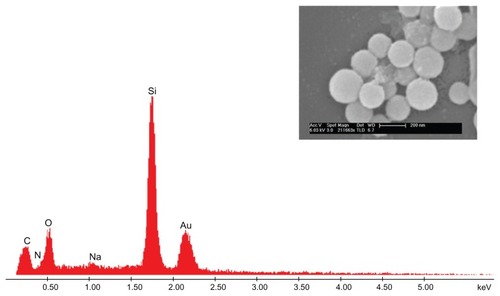
Figure 2 CS-HP nanocapsule.
Note: Scale bar is 1 μm.
Abbreviations: CS, chitosan; HP, heparin; LbL, layer-by-layer; SEM, scanning electron microscopy; TEM, transmission electron microscopy.
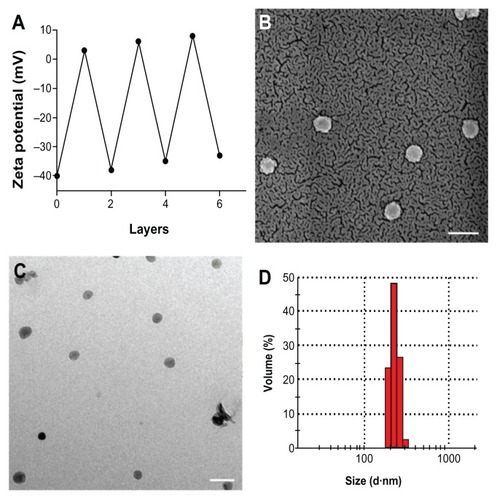
Figure 3 Hollow CS-HP nanocapsule.
Notes: EDS of empty capsules (see inset) shows no silica peak indicating complete removal of silica core.
Abbreviations: CS, chitosan; EDS, energy-dispersive X-ray spectrometry; HP, heparin; SEM, scanning electron microscopy.
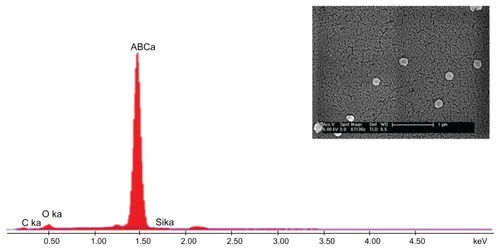
Figure 4 Drug release studies in acidic pH (4.8) and neutral pH (7.4).
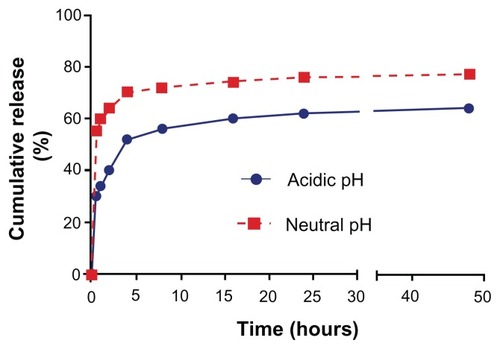
Figure 5 CLSM images of (1) B16-F10 and (2 and 3) MCF-7 cells incubated with CS-HP nanocapsules. While (1) and (2) show images of cells incubated with nanocapsules for 1 hour, the cells in (3) were incubated for 5 hours.
Notes: (A) Capsules loaded with doxorubicin appear red in color. (B) Nucleus stained blue using DAPI. (C) Bright field image ([3] MCF-7 cells show blebs, which is characteristic of apopotosis) and (D) combined field image. Scale bar is 5 μm.
Abbreviations: CLSM, confocal laser scanning microscopy; CS, chitosan; HP, heparin.
![Figure 5 CLSM images of (1) B16-F10 and (2 and 3) MCF-7 cells incubated with CS-HP nanocapsules. While (1) and (2) show images of cells incubated with nanocapsules for 1 hour, the cells in (3) were incubated for 5 hours.Notes: (A) Capsules loaded with doxorubicin appear red in color. (B) Nucleus stained blue using DAPI. (C) Bright field image ([3] MCF-7 cells show blebs, which is characteristic of apopotosis) and (D) combined field image. Scale bar is 5 μm.Abbreviations: CLSM, confocal laser scanning microscopy; CS, chitosan; HP, heparin.](/cms/asset/e6b8f121-feeb-47c6-ae1e-240cef737bd4/dijn_a_37737_f0005_c.jpg)
Figure 6 (A) Confocal image of CS-HP nanocapsule loaded with doxorubicin after 1 hour shows the nanocapsules located on the cell membrane as dots. (B) Confocal image of free doxorubicin after 1 hour shows it to be evenly distributed.
Abbreviations: CH, chitosan; HP, heparin.
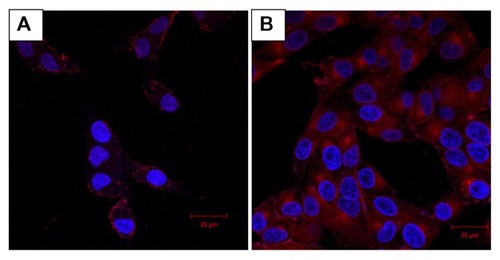
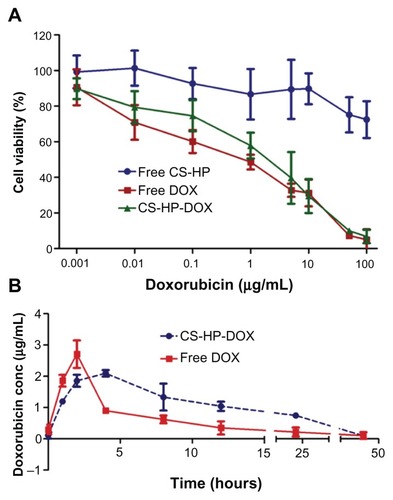
Figure 7 (A) MTT assay for cytotoxic assessment in MCF-7 cell line. Cytotoxicity effect of different concentration of empty capsules (free CS-HP), doxorubicin-loaded nanocapsules (CS-HP-DOX), and free-doxorubicin were checked using MTT assay. Data represents mean ± standard deviation. (B) Biodistribution studies done by injecting a single dose of 10 mg/kg doxorubicin in free form and encapsulated in nanocapsule. Serum was collected at different time periods and doxorubicin concentration was measured.
Abbreviations: CS, chitosan; DOX, doxorubicin; HP, heparin.