Figures & data
Figure 1 Stepwise synthesis of PLA-PEG copolymer showing (A) PEG, (B) PEGDA, (C) PEGDA amine, (D) activated PLA, and (E) PLA-PEG copolymer.
Abbreviations: PEG, poly(ethylene glycol); PLA, polylactic acid; PEGDA, PEG diacrylate.
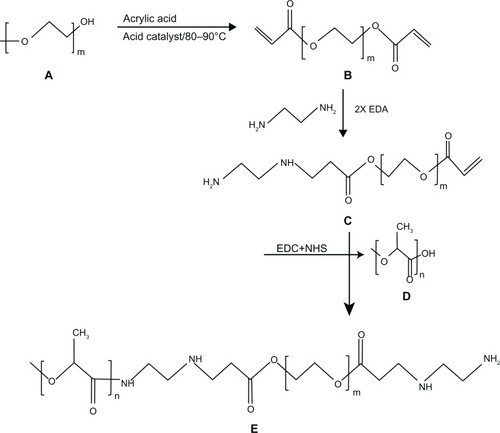
Table 1 Particle size and encapsulation efficiency of synthesized PLA-PEG nanoparticles with different PEG chain lengths
Figure 2 Molecular mass distribution of PLA-PEG copolymer determined by gel permeation chromatography.
Abbreviations: PEG, poly(ethylene glycol); PLA, polylactic acid.
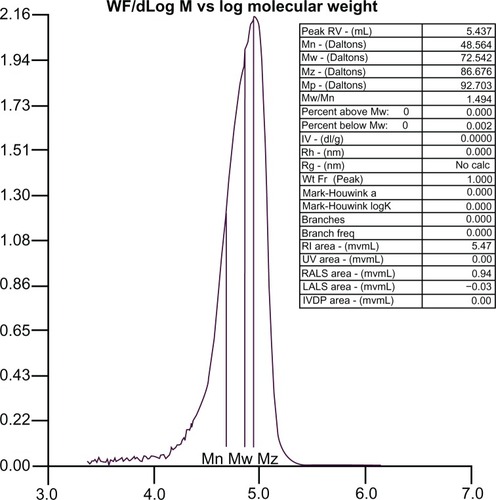
Figure 3 Nuclear magnetic resonance spectra of (A) PEGDA, (B) PEGDA aminated, (C) PLA, and (D) PLA-PEG.
Abbreviations: PEG, poly(ethylene glycol); PLA, polylactic acid; PEGDA, PEG diacrylate.
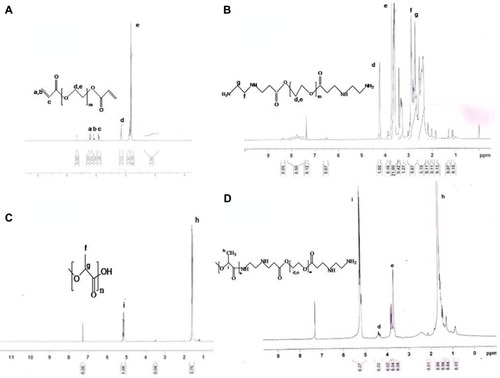
Table 2 Computational parameters used to construct aqueous-phase model building and simulations
Figure 4 Transmission electron micrograph of PLA-PEG nanoparticles.
Abbreviations: PEG, poly(ethylene glycol); PLA, polylactic acid.
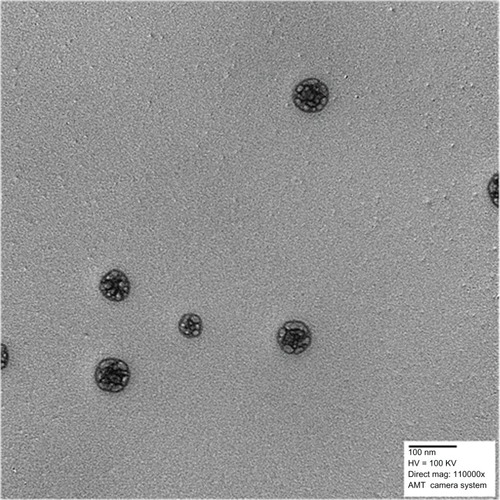
Figure 5 In vitro release of insulin from PLA-PEG4000 nanoparticles (n = 3) at pH 7.4.
Abbreviations: PEG, poly(ethylene glycol); PLA, polylactic acid.
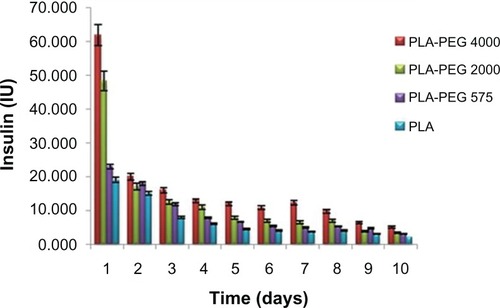
Figure 6 Hypoglycemic effect of PLA-PEG4000 nanoparticles parenteral depot administered to diabetic rabbits (n = 4) at a dose of 25 and 50 IU/kg body weight of insulin.
Abbreviations: PEG, poly(ethylene glycol); PLA, polylactic acid.
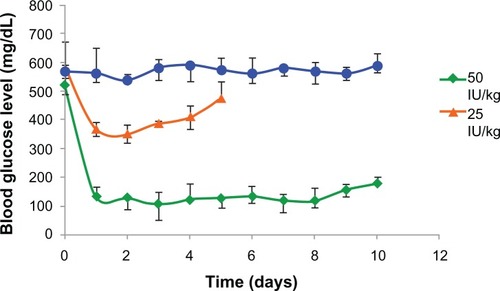
Figure 7 Low intensity photomicrograph of a skin section from (A) a control animal and (B) an animal subcutaneously administered PLA-PEG nanoparticles.
Abbreviations: PEG, poly(ethylene glycol); PLA, polylactic acid.
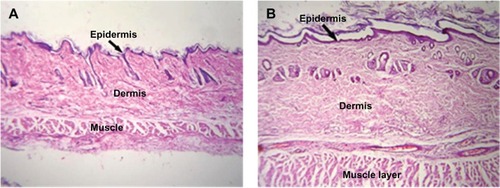
Figure 8 High intensity photomicrograph of a skin section from (A) a control animal and (B) an animal subcutaneously administered PLA-PEG nanoparticles.
Abbreviations: PEG, poly(ethylene glycol); PLA, polylactic acid.
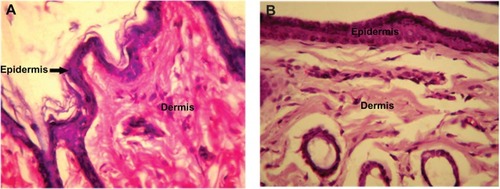
Figure 9 Visualization of geometrical preferences of (A) PLA-PEG1, (B) PLA-PEG2, and (C) PLA-PEG4 after molecular simulation in vacuum.
Notes: Elements are color coded: cyan = C; red = O; blue = N; yellow = P; white = H; brown = Zn.
Abbreviations: PEG, poly(ethylene glycol); PLA, polylactic acid.
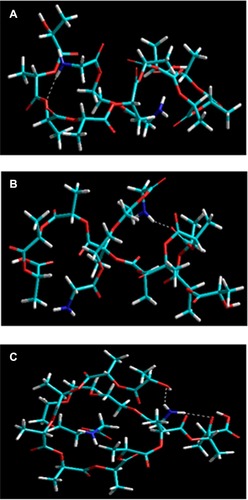
Figure 10 Visualization of geometrical preferences of (A) PLA-PEG1, (B) PLA-PEG2, and (C) PLA-PEG4 after molecular simulation in a solvated system consisting of 149 water molecules (blue molecules).
Note: The PLA (yellow) and PEG (red) are rendered in tube display.
Abbreviations: PEG, poly(ethylene glycol); PLA, polylactic acid.
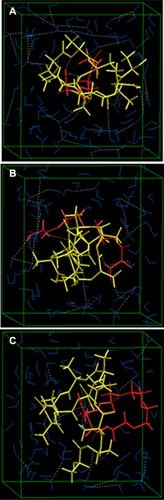
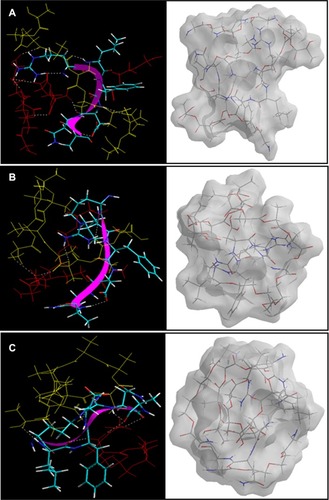
Figure 11 Visualization of geometrical preferences of the insulin molecule in complexation with (A) PLA-PEG14, (B) PLA-PEG22, and (C) PLA-PEG41 after molecular simulations in vacuum.
Notes: The peptide molecules are rendered in tube (elements color coded) and thin-ribbon secondary structures (violet). Color codes for insulin tube rendering: C (cyan), O (red), H (white), and P (yellow). The respective Connolly molecular electrostatic potential surfaces for the nanoparticulate matrix in transparent display mode are also shown.