Figures & data
Figure 1 Schematic representation of the synthesis of Magh-1-PNPs-NODA.
Abbreviations: CAN, ceric ammonium nitrate; PNPs, polyethyleneglycol-based nanoparticles; NODA, 2,2′-(7-(4-((2-aminoethyl)amino)-1-carboxy-4-oxobutyl)-1,4,7-triazonane-1,4-diyl)diacetic acid; PLGA-b-PEG, poly(D,L-lactide-co-glycolide)-block-poly(ethylene glycol).
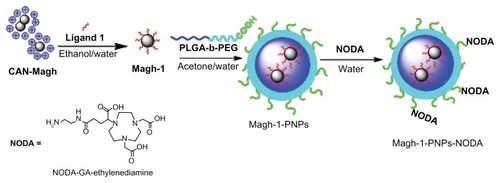
Table 1 Relaxivity values obtained for Magh, Magh-1-PNPs, and Magh-1-PNPs-NODA
Figure 2 TEM image and relative DLS measurements of Magh-1-PNPs. TEM image (A) and relative DLS measurements (B) of Magh-1-PNPs.
Abbreviations: TEM, transmission electron microscopy; PNPs, polyethyleneglycol-based nanoparticles; DLS, dynamic light scattering.
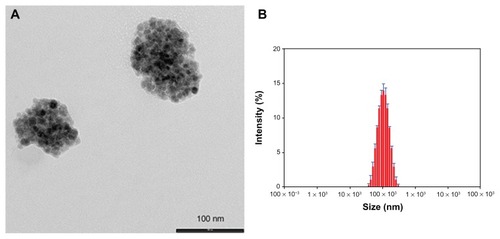
Figure 3 Cellular viability rate versus maghemite concentration after 72 hour incubation with Magh-1-PNPs-NODA NPs.
Notes: Relative values were normalized to the values from the corresponding untreated cells and are shown as percent of survival. Results are expressed as a mean percentage of three independent experiments performed in triplicate ± SD.
Abbreviations: NPs, nanoparticles; PNPs, polyethyleneglycol-based nanoparticles; NODA, 2,2′-(7-(4-((2-aminoethyl)amino)-1-carboxy-4-oxobutyl)-1,4,7-triazonane-1,4-diyl)diacetic acid; SD, standard deviation.
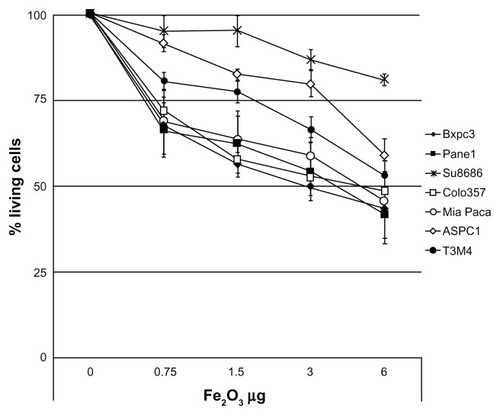
Figure 4 TLC profiles obtained for 68Ga-labelled NPs (red line, Rf = 0) and free EDTA-68Ga complex (black line, Rf = 0.35).
Note: The complex EDTA-68Ga is generated in situ.
Abbreviations: TLC, thin layer chromatography; NPs, nanoparticles; EDTA, ethylenediaminetetra-acetic acid; NODA, 2,2′-(7-(4-((2-aminoethyl)amino)-1-carboxy-4-oxobutyl)-1,4,7-triazonane-1,4-diyl)diacetic acid.
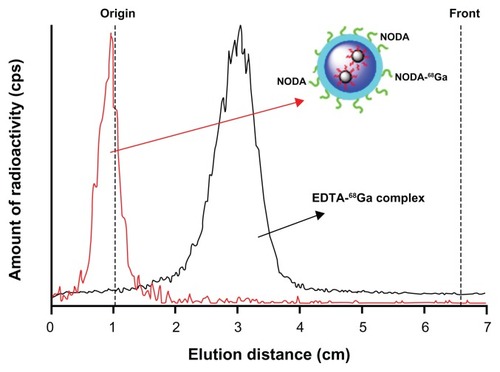
Figure 5 PET image and CT time-activity curves of 68Ga. PET image of 68Ga-labeled NPs signal corresponding to averaged time frames at t > 20 minutes after IV injection (A). CT images were adjusted on the Y-axis for an appropriate fitting with the tracer distribution. Time-activity curves for heart (B), brain (C), lungs (D), kidneys (E), spleen (F), and liver (G) after IV administration of 68Ga-labeled NPs.
Note: Average values +/− standard deviation (n = 3) are shown.
Abbreviations: PET, positron emission tomography; CT, computerized tomography; NPs, nanoparticles; IV, intravenous; ID, injective dose.
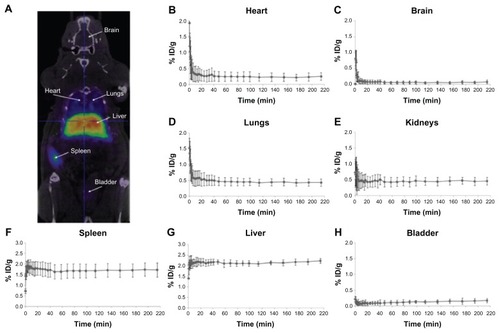
Figure S1 Transmission electron microscopy image of ceric ammonium nitrate (CAN)-Magh nanoparticles (NPs).
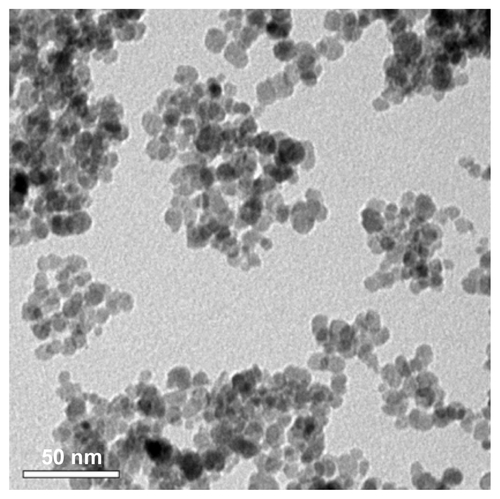
Figure S2 Synthesis of ethyl 12-hydroxydodecanoate.
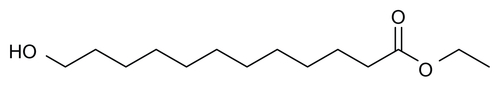
Figure S3 Synthesis of 12-ethoxy-12-oxododecanoic acid.
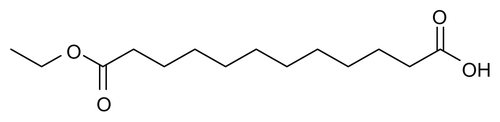
Figure S4 Synthesis of ethyl 12-((3,4-dihydroxyphenethyl)amino)-12-oxododecanoate (EDAO, 1).
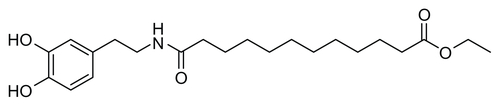
Figure S5 Infrared spectra of ceric ammonium nitrate (CAN)-Magh (black line) and Magh-1 (blue line).
Abbreviation: T, transmittance.
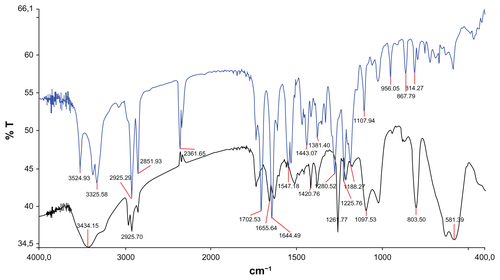
Figure S6 Solubility test of ceric ammonium nitrate (CAN)-Magh versus Magh-1 (A) and thermogravimetric analysis of Magh-1 (B).
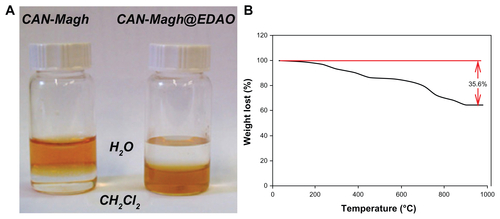
Figure S7 Synthesis of Magh-1-PNPs-NODA.
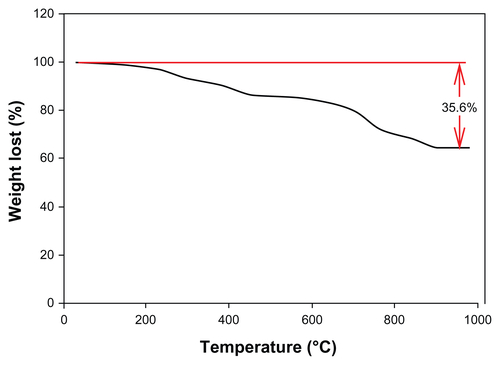
Table S1 Statistical analysis of the mean values reported in