Figures & data
Figure 7 Continued.
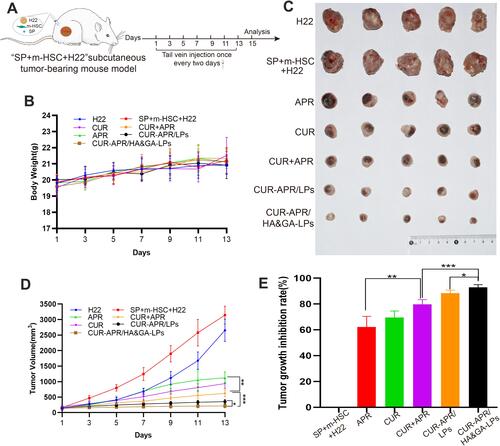
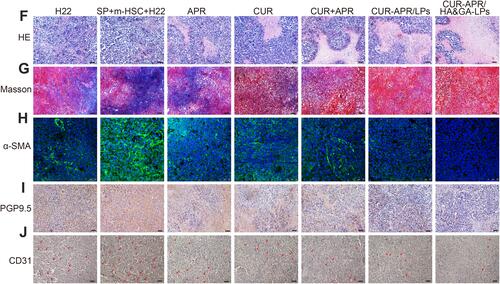
Figure 7 In vivo antitumor activity in “SP+m-HSCs+H22” tumor-bearing mice. (A) Schematic illustration of treatment scheme on mice. (B) Tumor images of mice treated with different drug formulations. (C) The body weight in mice. (D) Tumor growth inhibition curves. (E) Tumor growth inhibition rate. H&E (F), and Masson trichromatic staining (G) analysis of tumor tissues slices. (H) α-SMA immunofluorescence staining (green fluorescence: α-SMA protein). Immunohistochemical assay of PGP9.5 proteins (I) and CD31 proteins (J). Red arrows: CD31 proteins. Scale bar: 50 μm, *P < 0.05, **P < 0.01, ***P < 0.001.