Figures & data
Figure 1 Characterization of ACNP. (A) AFM image of ACNP. (B) TEM image of ACNP. (C) size distribution of ACNP by laser particle size analyzer.
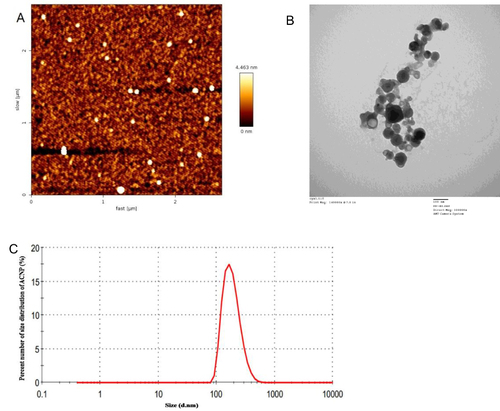
Figure 2 Drug loading of ACNP-MET. (A) Standard curve. A=0.00479+0.08137C (r2=0.9995, P<0.0001). (B) adsorption-time relation. (C) adsorption-concentration curve. C/Q= −0.00531+0.00399C (r2=0.995, P<0.001), C is the concentration of MET in the suspension, Q is the drug loading; saturated adsorption quantity of ACNP for MET: Qm=256.17 mg/g at mass ratio of ACNP: MET=4:1. (D) A release profile of MET from ACNP-MET in PBS buffer at 37°C. The release rate of MET was 20.69% during 72 h. Data are presented as the mean±standard deviation (SD).
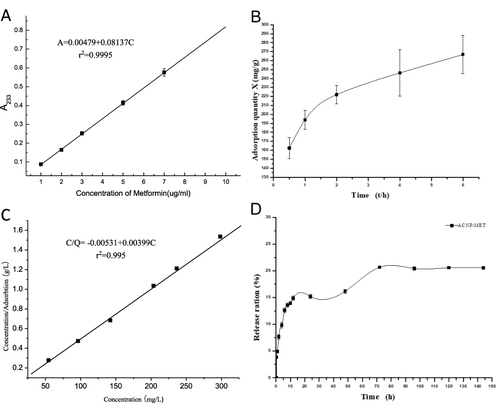
Figure 3 Sorting of hepatocellular CSCs. (A) Expression of CD133 marker in hepatocellular cancer line Huh-7 by fluorescence-activated cell sorting (FACS) analysis. (a1) CSCs stained with IgG-PE antibody as isotype control; (a2) CSCs stained with anti-CD133-PE antibody. (B) Image of CD133+ cells (b1) and CD133− cells (b2) sorted from Huh-7 cells cultured in serum-free medium for 7 days under the light microscope. (C) Identification of the phenotype of the hepatocellular CSCs cultured for 7 days in serum-free medium. (c1) CSCs stained with IgG-PE antibody as isotype control; (c2) CSCs stained with anti-CD 133-PE antibody.
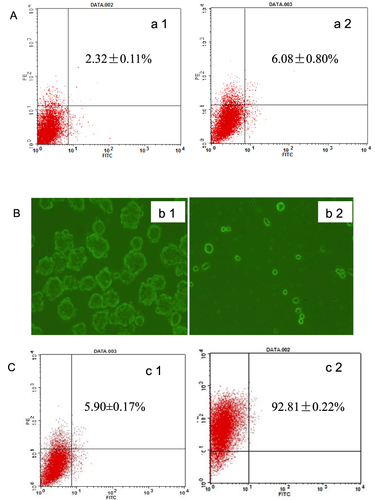
Figure 4 Inhibitory effects of drugs on CD133+ cells (A) and CD133− cells (B) at 48 h measured by CCK-8 assay after treatment. Data are presented as mean ± SD from triple experiments. **P < 0.01, versus free MET.
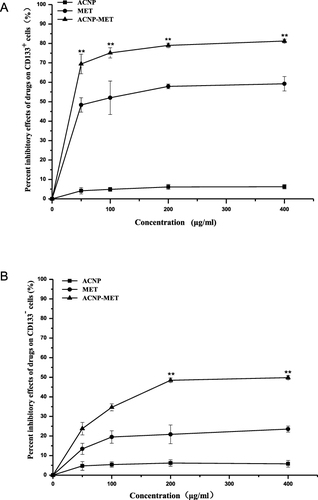
Figure 5 Continued.
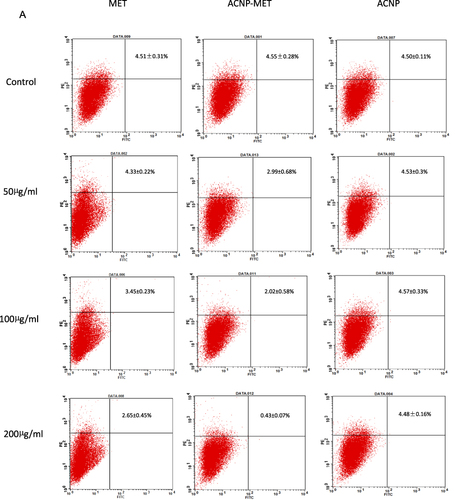
Figure 5 Continued.
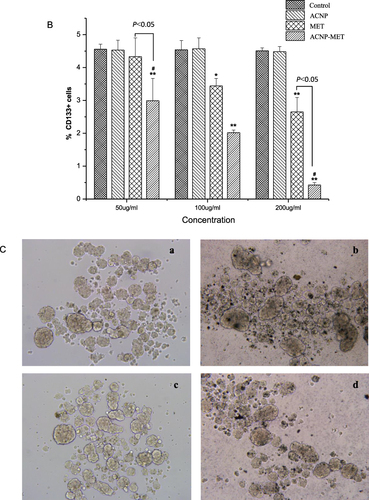
Figure 5 Continued.
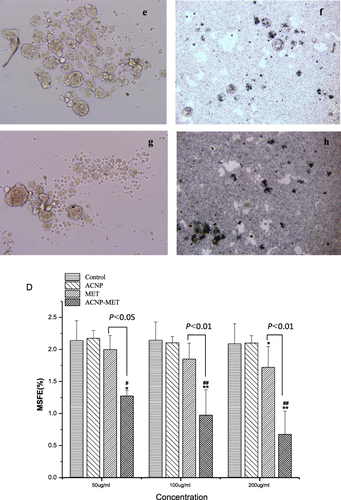
Figure 5 Inhibitory effects of drugs on the self-renewal capacity of hepatocellular CSCs in vitro. (A) The CD133 expression of Huh-7 hepatocellular cancer cells after treatment measured by flow cytometry. (B) Average percentage of CD133+ cells in Huh-7 hepatocellular cancer cells after treatment. *P<0.05, **P<0.01, statistically significant difference from control; #P<0.05, statistically significant difference from MET. (, n=5). (C) Representative light microscope images of hepatocellular CSCs growing in sphere medium for 7 days after different treatment (100× magnifications). (a) control; (b) ACNP 500 µg/mL; (c) MET 50 µg/mL; (d) ACNP-MET 50 µg/mL; (e) MET 100 µg/mL; (f) ACNP-MET 100 µg/mL; (g) MET 200 µg/mL; (h) ACNP-MET 200 µg/mL. (D) MSFE of CD133+ cells was calculated as the number of mammospheres (diameter >50 µm) formed in 7 days. *P<0.05, **P<0.01, statistically significant difference from control; #P<0.05, ##P<0.01, statistically significant difference from MET. (
, n=5). (E) Fold-decrease in the MSFE of hepatocellular CSCs mammospheres after different treatment.
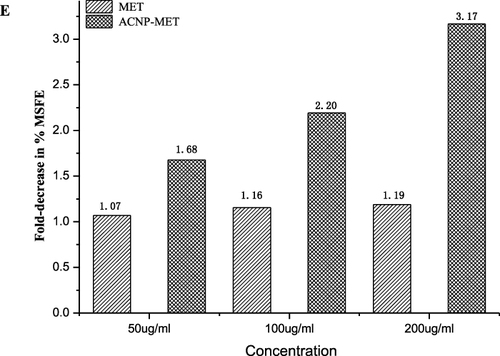
Figure 6 Continued.
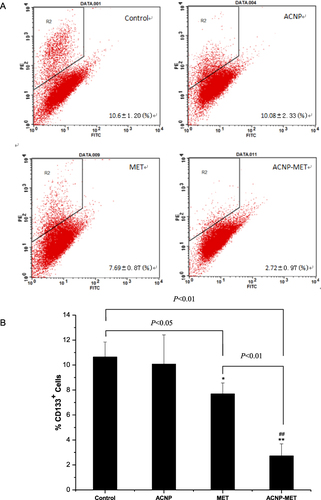
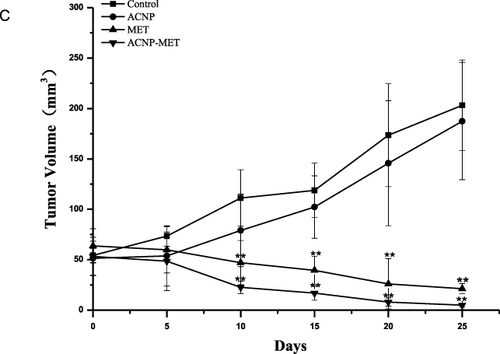
Figure 6 Inhibitory effects of ACNP-MET on the self-renewal capacity of hepatocellular CSCs in vivo. (A) Flow cytometry. (B) Percentage of CSCs in tumors. (C) Tumor volume. Data are shown as mean ± SD, n =6. *P<0.05, **P<0.01, statistically significant difference from control; ##P<0.01, statistically significant difference from MET.