Figures & data
Figure 1 Ultraviolet-visible absorbance spectrum (A) graphene oxide and (B) functionalized graphene oxide, and transmission electron microscopic images of (C) graphene oxide and (D) functionalized graphene oxide.
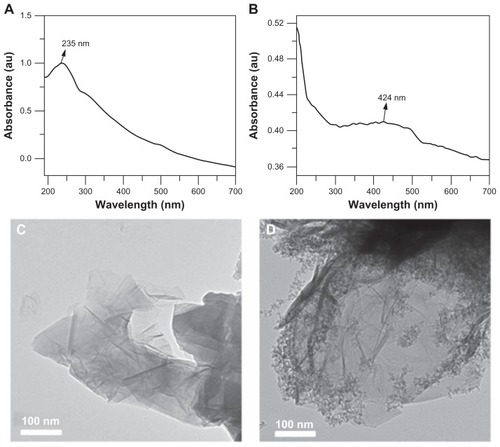
Figure 2 Raman spectrum of graphene oxide and functionalized graphene oxide.
Abbreviations: GO, graphene oxide; FGO, functionalized graphene oxide.
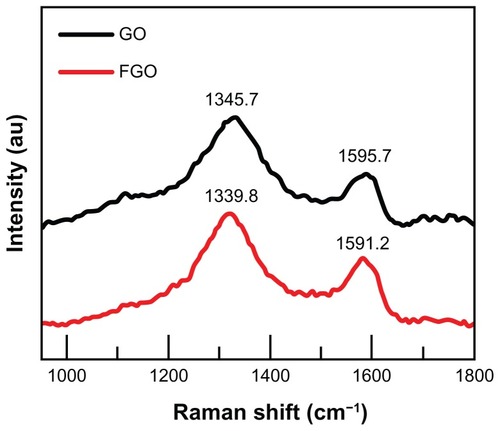
Figure 3 (A) Illustration of the electrochemical setup under electrolyte solution. Dotted circle depicts the digital image of Au-PCB working electrode and the process of glucose oxidase modification at two different stages, ie, Au-PCB-GO and Au-PCB-FGO biosensor platform, respectively. (B) Enzymatic reaction at the electrode interface and its respective cyclic voltammogram.
Abbreviations: Ag/AgCl, silver/silver chloride; RE, reference electrode; Pt, platinum; CE, counter electrode; Au-PCB, gold printed circuit board electrode; WE, working electrode; Au-PCB-GO, gold printed circuit board electrode modified with graphene oxide; Au-PCB-FGO, gold printed circuit board electrode modified with functionalized graphene oxide; GOx, glucose oxidase; Ag@SiO2-PEG, silver-silica coated with polyethylene glycol; FGO, functionalized graphene oxide; GO, graphene oxide.
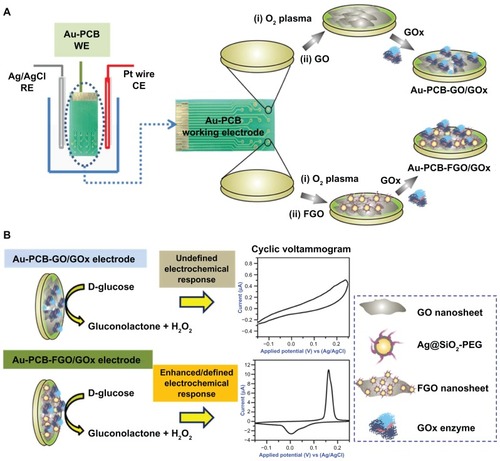
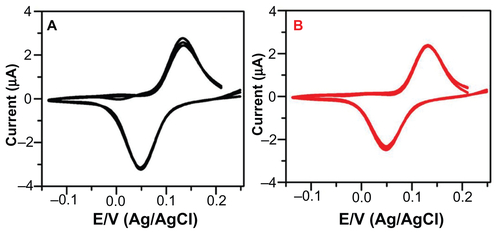
Figure 4 (A) CVs of GOx-modified Au-PCB (black trace), Au-PCB-GO (red trace), and Au-PCB-FGO electrode in PBS buffer (pH 7.4). (B) Focused CV curve of Figure 4A (green trace) GOx-modified Au-PCB-FGO electrode. (C) CVs of bare Au-PCB/GOx (black trace) and Au-PCB-GO/GOx (red trace) versus 20 mM D(+) glucose in PBS (pH 7.4). (D) CVs of Au-PCB-FGO-GOx versus D(+) glucose in PBS buffer at different concentration ranges from 20 mM to 0.1 mM, and the inset shows the corresponding plot of peak currents against molar concentrations of glucose.
Notes: Scan rate: 50 mV/s. All the individual CV responses were measured by different electrodes prepared appropriately.
Abbreviations: CVs, cyclic voltammograms; GOx, glucose oxidase; Au-PCB, gold printed circuit board electrode; Au-PCB-GO, gold printed circuit board electrode modified with graphene oxide; Au-PCB-FGO, gold printed circuit board electrode modified with functionalized graphene oxide; Au-PCB-FGO-GOx, gold printed circuit board electrode modified with functionalized graphene oxide and glucose oxidase; PBS, phosphate-buffered saline; Ag/AgCI, silver/silver chloride.
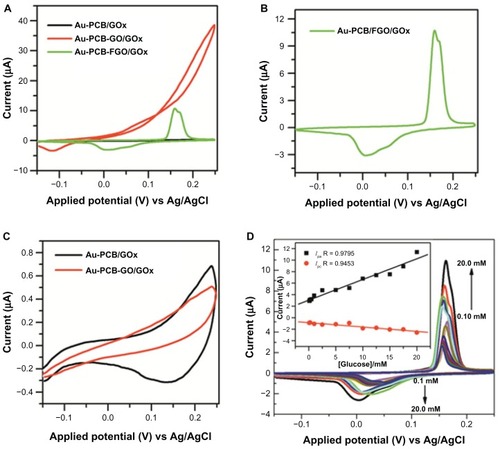
Figure 5 (A) CVs of Au-PCB-FGO-GOx against glucosuria sample (injected into supporting electrolyte) and (B) histogram of peak currents for Au-PCB-FGO/GOx electrode against glucosuria sample of different volumes from one diabetic patient, ensuring the linear relationship between the volume and peak current.
Notes: Where error bars are not visible, they are smaller than the symbols. Scan rate: 50 mV/s.
Abbreviations: CVs, cyclic voltammograms; Au-PCB-FGO-GOx, gold printed circuit board electrode modified with functionalized graphene oxide and glucose oxidase; Ag/AgCI, silver/silver chloride.
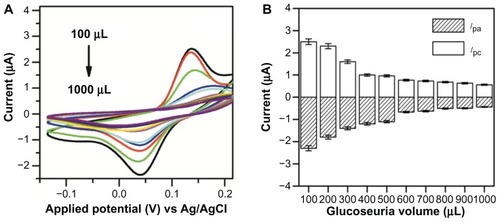
Figure 6 (A) CVs of Au-PCB-FGO-GOx against serum glucose samples (modified on electrode) from diabetic patients and (B) histogram of peak currents for Au-PCB-FGO/GOx electrode against serum samples from low to high concentration from different diabetic patients.
Notes: Where error bars are not visible, they are smaller than the symbols. Scan rate: 50 mV/s.
Abbreviations: CVs, cyclic voltammograms; Au-PCB-FGO-GOx, gold printed circuit board electrode modified with functionalized graphene oxide and glucose oxidase; Ag/AgCI, silver/silver chloride.
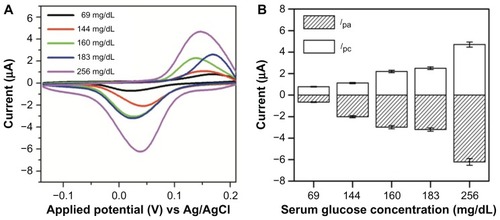
Table S1 Shows the patient details in terms of their age, gender and glucose concentration measured by commercial sensor Accu-Chek® from Roche (Basel, Switzerland)
Figure S1. (A) Ultraviolet-visible absorbance spectrum, and (B) particle size distribution histogram of metalloid polymer hybrid nanoparticles (Ag@SiO2-PEG) from electrophoretic light scattering measurements. (C) Field emission scanning electron microscopic (scale bar 30 nm) and (D) high resolution transmission electron microscopic images (scale bar 10 nm) of metalloid polymer hybrid nanoparticles.
Abbreviations: Ag@SiO2-PEG, silver-silica coated with polyethylene glycol; LS int., light scattering intensity.
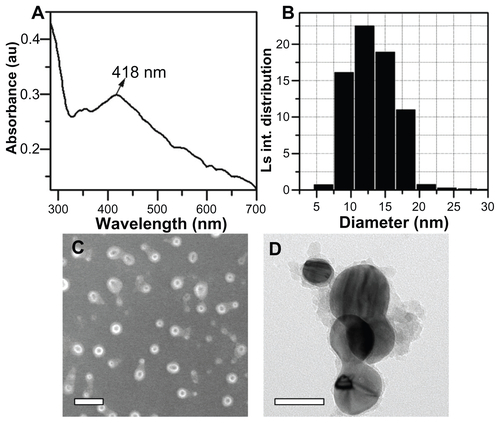
Figure S2. Fourier transform infrared absorbance spectra of (A) GO, (B) MPHs, and (C) FGO.
Abbreviations: GO, graphene oxide; MPHs, metalloid polymer hybrid nanoparticles; FGO, functionalized graphene oxide.
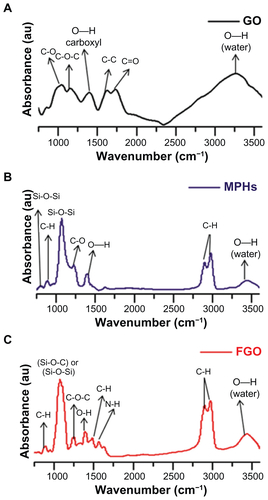
Figure S3. CVs of Au-PCB-FGO-GOx versus different clinical glucosuria samples (urine samples from five patients named A–E) at volumes of 10, 60, and 160 μL in phosphate-buffered solution. (F) Cathodic peak current histogram for five glucosuria samples.
Notes: This result shows the preliminary clinical diagnostics of urine samples from hyperglycemic patients. Scan rate: 50 mV/s.
Abbreviations: CVs, cyclic voltammograms; Au-PCB-FGO-GOx, gold printed circuit board electrode modified with functionalized graphene oxide and glucose oxidase; Ag/AgCI, silver/silver chloride.
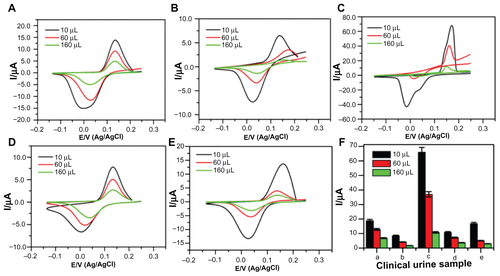
Figure S4. Multiple cycle CV segments of Au-PCB-FGO-GOx versus glucose serum sample (glucose concentration in serum 131 mg/dL, measured by Accu-Chek®) electrode measured on day 0 (A, black trace) and after 50 days (B, red trace) stored in refrigeration at 4°C.
Note: Scan rate: 50 mV per second.
Abbreviations: CV, cyclic voltammogram; Au-PCB-FGO-GOx, gold printed circuit board electrode modified with functionalized graphene oxide and glucose oxidase; Ag/AgCI, silver/silver chloride.