Figures & data
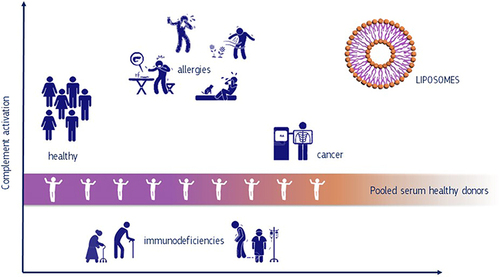
Figure 1 Overview of the whole workflow in the experimental setup: Selection of complement activators; Quality assessment; Complement activation.
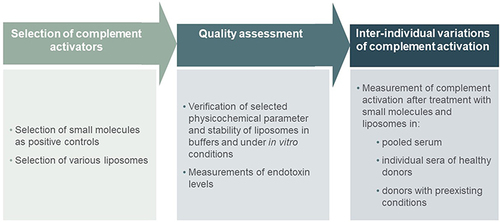
Figure 2 Serology testing protocol for evaluation of potential complement activation effects of test samples (ie, liposomes) in human serum.
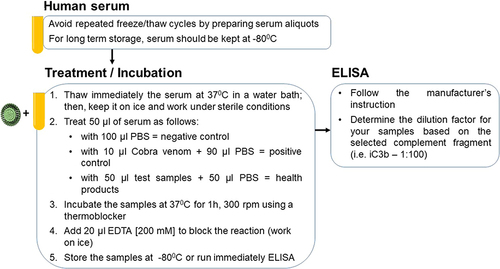
Figure 3 iC3b levels measured in pooled human serum incubated with positive and negative controls.
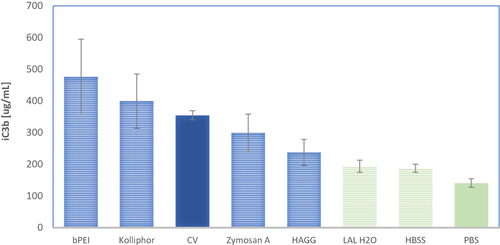
Figure 4 Variability of iC3b complement fragment determined in healthy donors compared to pooled serum.
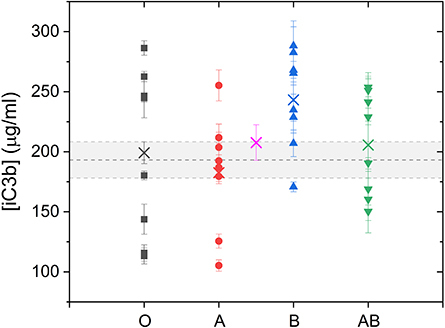
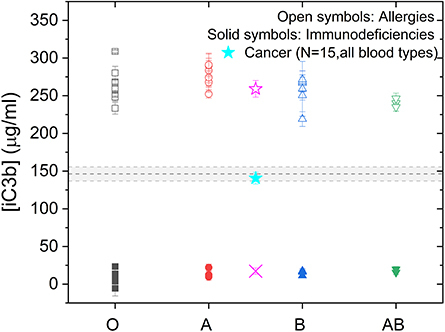
Figure 5 iC3b levels in sera of donors with allergy, immunodeficiency or cancer disease exposed to cobra venom.
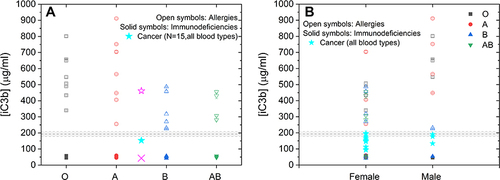
Figure 6 Liposome inducing changes in complement activation product iC3b measured in sera of healthy donors.
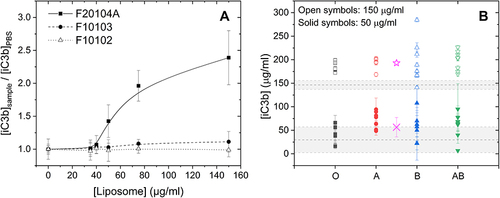
Figure 7 Liposome induced iC3b cleavage after treatment of sera from donors with pre-existing conditions.