Figures & data
Figure 1 The differentiation direction of stem cells.
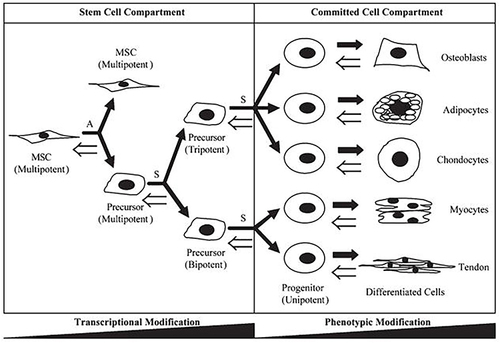
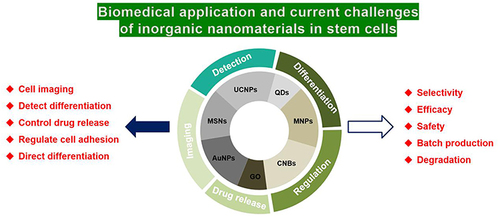
Figure 2 All kinds of different biomedical application of UCNPs.
Figure 3 NIR light trigger of photo-uncaging and intracellular release of KGN or calcium by UCNPs nanocarriers to control the differentiation of stem cells in vitro and in vivo.
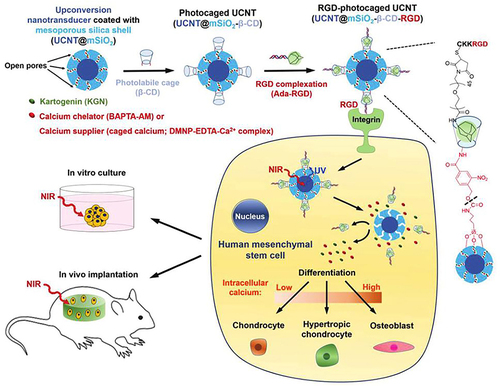
Figure 4 Schematic illustration of synthesis of UCNPs nanocarriers for tissue penetration of NIR-triggered release of KGN to induce the chondrogenic differentiation of stem cells in vitro and in vivo. (A) The synthesis of UCNP nanocarriers and NIR trigger release KGN of UCNP nanocarriers. (B) Near-infrared light penetrates the skin compared to ultraviolet light for trigger release KGN from UCNP nanocarriers.
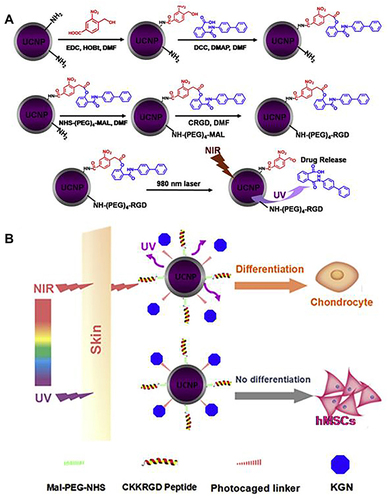
Figure 5 Schematic diagram of “sandwich” structure biosensor that based on UCNPs and the application of detecting dopamine in neural differentiation of stem cells (A), and the comparing energy migration mechanism of Yb/Er codoped UCNPs, Yb/Er@Yb “active-shell” UCNPs and novel Yb@Er@Yb “sandwich” UCNPs (B).
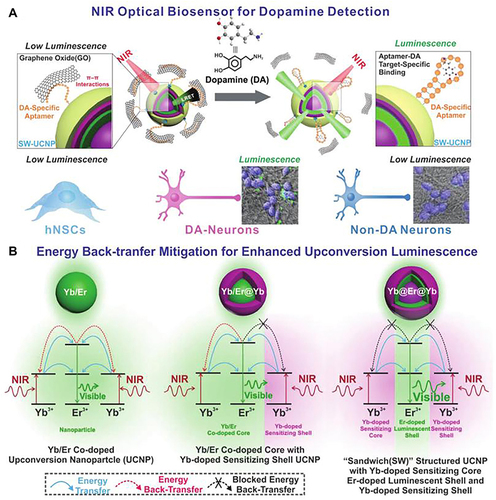
Figure 6 Schematic diagram of UCNPs substrate for controlling the multidirectional differentiation of stem cells by adjusting the power of NIR light.
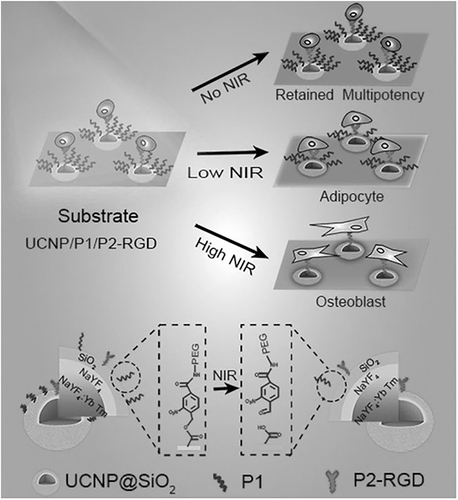
Figure 7 Schematic diagram of UCNPs substrate to control cell adhesion, spreading and multidirectional differentiation of stem cells by adjusting power of NIR light. (A) Synthetic procedure for UCNP@SiO2-RGD-ONA and NIR light-triggered cleavage of an ONA protective group. (B) The potential mechanism underlying the UCNP-substrate RGD photoactivated to control the adhesion, spreading, and differentiation of MSCs, governed by mechanosensing signaling. (C) NIR-triggered release of ONA to control cell adhesion, spreading, and multidifferentiation of MSCs in vivo on the UCNP-substrate by different powers of NIR irradiation.
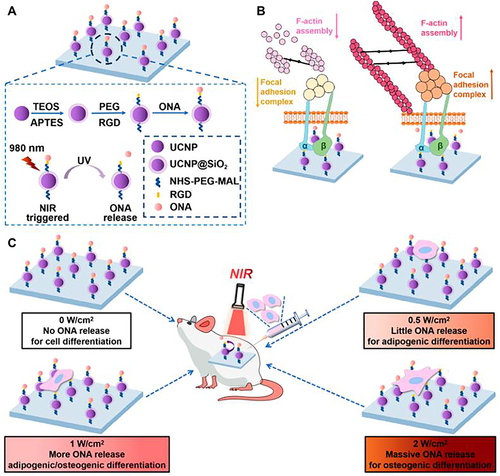
Figure 8 The emission of QDs when compared with organic dyes. (A) Absorption and emission spectrum of six different QDs. (B) Absorption and emission spectrum of two organic dyes, Cy3 and Cy5. (C) Comparison of fluorescence photo graphs of six QD in (A) with CdSe core sizes.
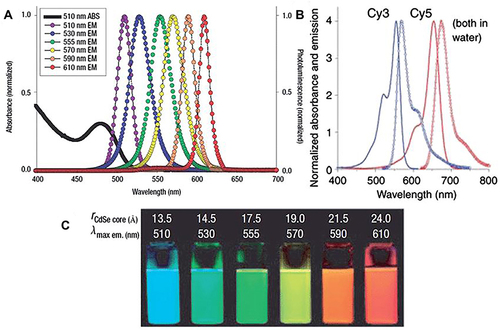
Figure 9 Schematic of targeted labeling hEstem cells by different modified QDs. (A) Phages that specifically bind to human ESCs were enriched in the phage pool by two rounds of bio-panning. (B) Illustration of chemical conjugation between the phage and QDs. (C) This enlarged view of (B) shows how the –NH2 groups on the phage are conjugated to the free –COOH groups on the surface of the QDs via EDC.
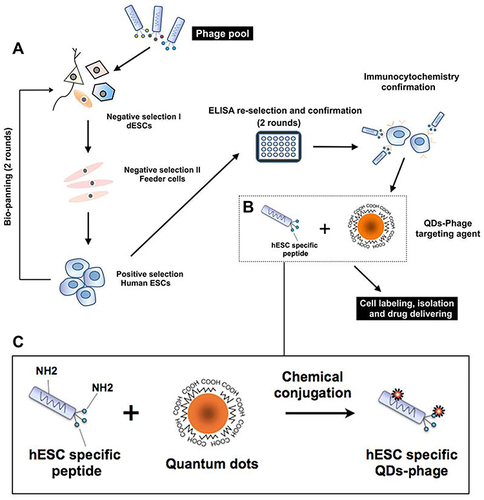
Figure 10 Schematic of RGD-CD-QDs as nanocarriers and nanoprobes to deliver small molecule and siRNA for controlling the chondrogenic differentiation of hMSCs and simultaneously long-term tracking hMSCs in vitro and in vivo.
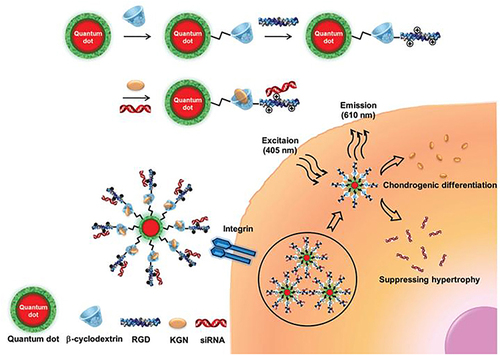
Figure 11 Schematic diagram of synthesizing novel MNPs for stem cells labeling and MRI imaging in vivo.
Figure 12 Schematic diagram of the silica coated MNPs modified glass substrate controlled cell adhesion, spreading and differentiation of hMSCs by magnetic field.
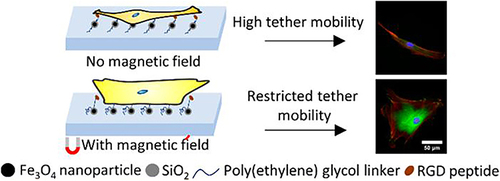
Figure 13 The RGD peptide conjugated MNPs modified a soft hydrogel substrate to inhibit/enhance the cell adhesion and mechanosensing-dependent differentiation of hMSCs by magnetic field.
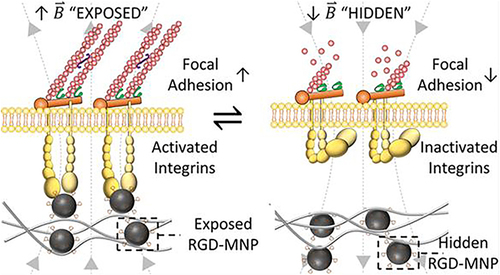
Figure 14 Remote control of multimodal ligand oscillations was used to regulate the adhesion and differentiation of stem cells by altering the oscillation frequency of the magnetic field.
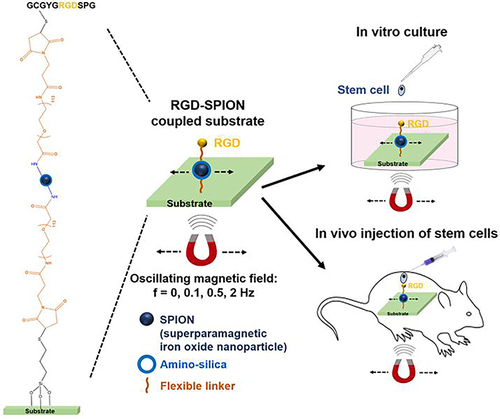
Figure 15 Schematic diagram of MNPs/AuNPs hybrid system nano-substrate was remotely controlled to regulate cell adhesion, spreading and differentiation of stem cells by reversibly manipulating RGD ligand cage and uncaging utilizing magnetic field.
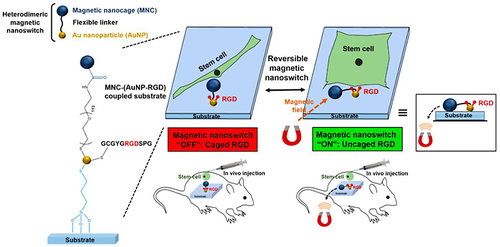
Figure 16 Schematic diagram of intracellular internalization and endolysosomal escape of FITC-MSNs in hMSCs.
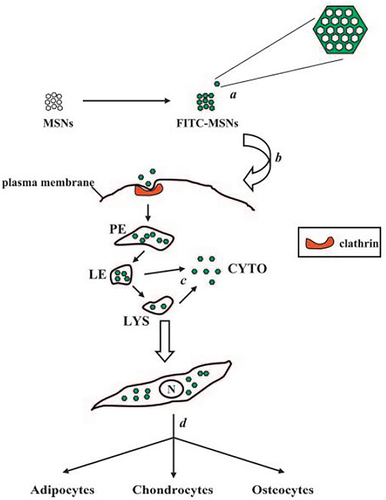
Figure 17 Schematic diagram of theranostic MSNs and characteristic of MSNs. (A) MSNs have impedance mismatch to backscatter ultrasound, MRI signal via Gd3+ and optical signal from fluo rescein. (B) TEM image of MSNs. (C) Enlarged TEM image of MSNs with 4.1 nm pores. (D) Red box in B indicates area imaged at higher magnification in C, line in C is representative of profile used to construct D. (E) DLS of MSNs. (F) EDS of MSNs shows expected peaks for silicon and oxygen as well as gadolinium from the secondary tag. (G) Histogram of MSN sizes from the TEM data in nm.
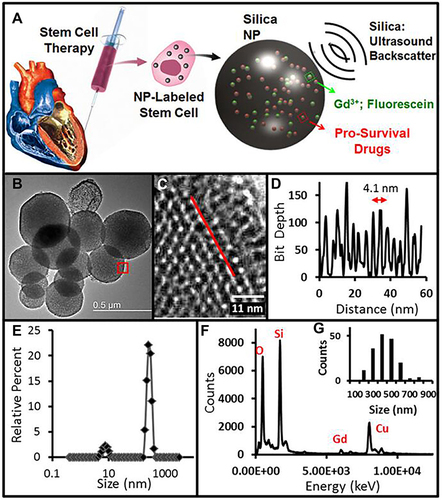
Figure 18 Schematic illustration and characterization of the stem cell-based multifunctional MSN-based platform for targeting delivery. (A) Schematic of the structure of the MSC-platform showing the internal and external layer. (B) The fluorescence properties of the MSNs. (C) TEM images of MSNs before and after HA coating. (D) and (E) 3D co-localization imaging of MSC-platform by confocal microscopy. The signal intensity (white line) of actin, particles and nucleus were quantified (E).
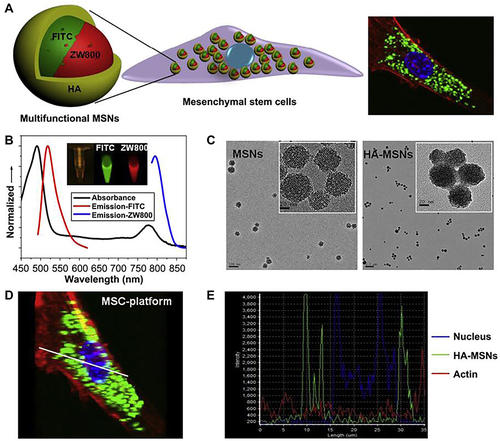
Figure 19 Schematic illustration of synthesis of the DEX@MSNs-pep nanocomplexes and the size distribution of MSNs and MSNs-pep by TEM and DLS. (A) Schematic illustration for the preparation of DEX@MSNs-pep. (B) TEM images of MSNs (inset is the enlarged image). (C) MSNs-pep. (D) Size distribution of MSNs and MSNs-pep.
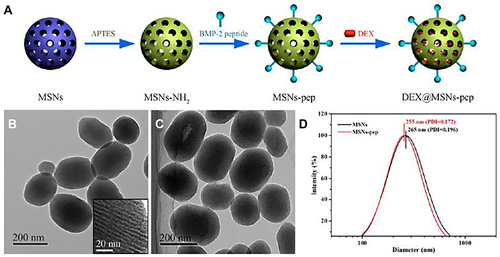
Figure 20 Schematic illustration of PLGA/MSH-AL’s three-level structure.
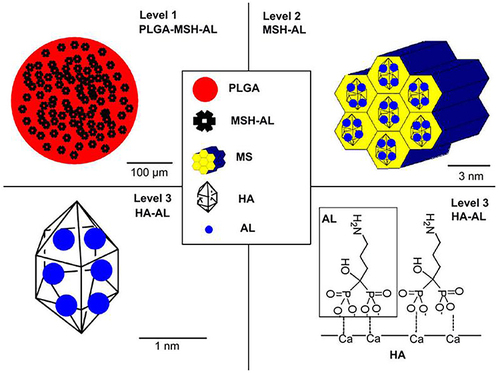
Figure 21 Schematic diagram of fabrication and application of GO-based nanofiber hybrid scaffolds for enhancing the differentiation of mature oligodendrocytes in stem cells.
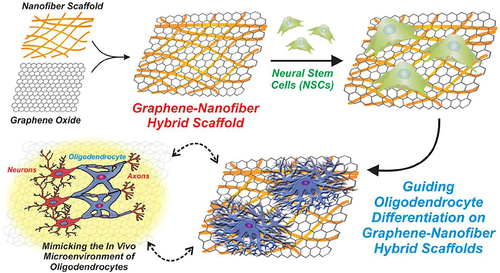
Figure 22 Schematic illustration of multifunctional GO-Au hybrid nanoelectrode arrays (NEAs) and its application for enhancing the differentiation of stem cells and monitoring the osteogenic differentiation of stem cell. (A) Investigation of the combinatorial effects of physicochemical cues on stem cell. (B) Identification of optimal biophysical cues for stem cell differentiation. (C) Enhanced electrochemical signal for monitoring osteogenic differentiation.
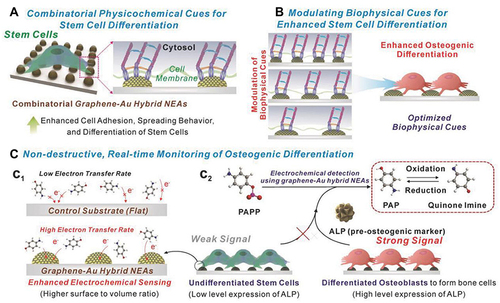
Figure 23 Schematic illustration of the GO modified substrate and its application of promoting the cell adhesion of hNSCs and enhancing the differentiation into neurons by GO.
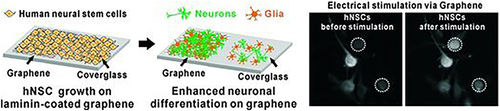
Figure 24 Schematic illustration of the SiO2 modified, GO modified and SiO2-GO modified substrates and their application of inducing the neuronal differentiation and axonal alignment of hNSCs. (A) Different control and experimental conditions for differentiating hNSCs into neurons. (B) hNSCs cultured and differentiated on Substrate D having a monolayer of NPs coated with GO show enhanced neuronal differentiation and axonal alignment.
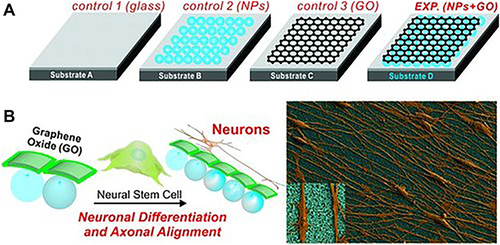
Figure 25 The annealed-GO modified substrate exhibited a higher amount of molecular adsorption and peptide-grafted content, enabling the osteogenic differentiation of hMSCs toward oxygen content.
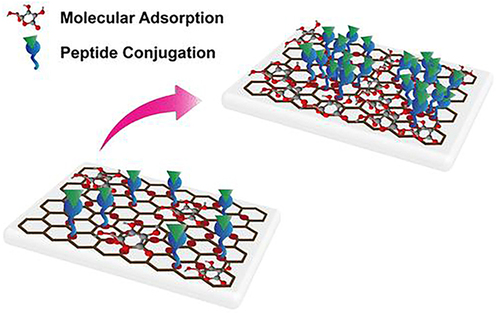
Figure 26 The application of AuNPs in biomedical field.
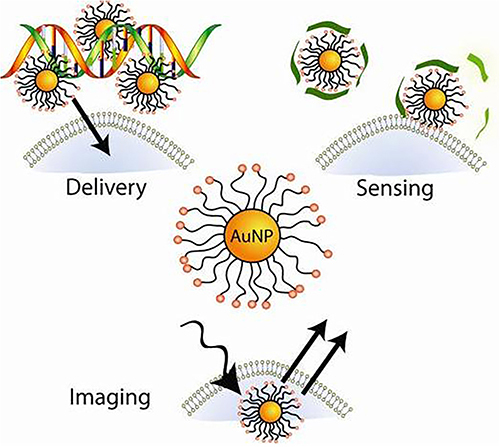
Figure 27 The different size and shape of AuNPs affect the osteogenic differentiation response of hMSCs.
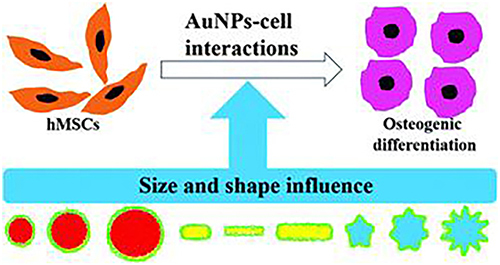
Figure 28 Schematic illustration of a two-nanoparticle system for labeling mesenchymal stem cells with gold nanorods and macrophages with gold nanospheres.
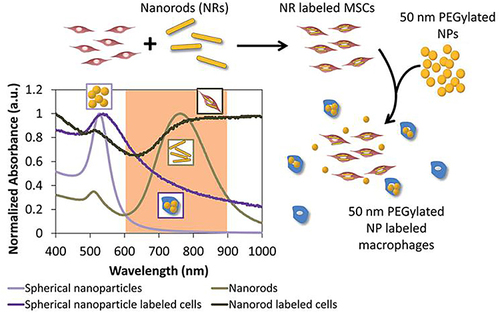
Figure 29 AuNPs (AuNP-PEI-peptide-FITC) and siRNA can silence PPARg gene to control osteogenic differentiation, and detect the cell differentiation level in hMSCs in real time.
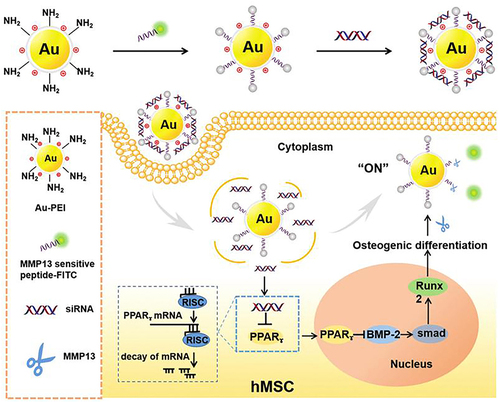
Figure 30 The AuNPs modified RGD-coupled substrate and its application of controlling cell adhesion, spreading and differentiation of stem cell by different coupling strength.
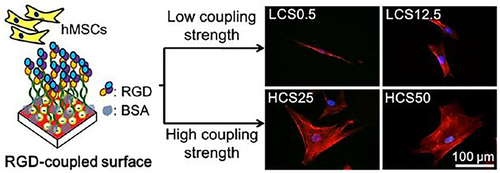
Figure 31 Schematic of four modified AuNPs modified matrices to study the effect of matrix stiffness and organization of cell adhesion ligands on adhesion and differentiation of rat mesenchymal stem cells.
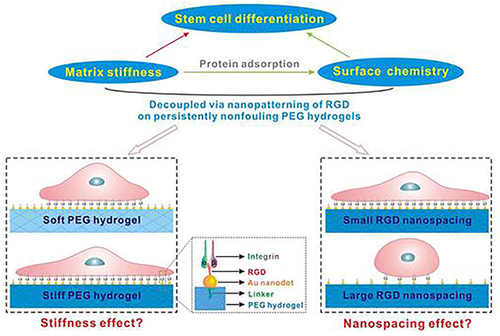
Figure 32 Schematic representation of the RGD-AuNPs modified micro/nanopatterns with different RGD nanospacings to control the cell spreading size and cell differentiation of stem cells.
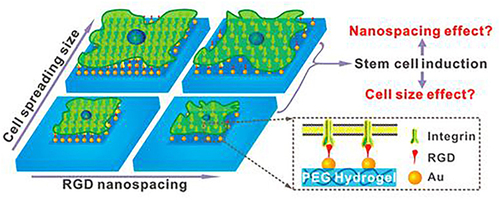
Figure 33 Schematic summary and characterization of the array of RGD-bearing gold nanorods (AuNRs) modified glass with various aspect ratios (ARs, 1, 2, 4, and 7) for enhanced cell adhesion and osteogenic differentiation in stem cells. (A–C) Schematic illustration of fabrication of immobilized RGD-conjugated AuNRs substrate blocked by nonfouling poly(ethylene) glycol. (D) UV–vis absorbance of AuNRs with different aspect ratios. (E–H) TEM images of AuNRs with different aspect ratios. (I–L) SEM images of AuNRs with different aspect ratios. (M–P) Schematic illustration postulation of how AuNRs with various ARs regulate cell adhesion structures, the differential recruitment and spatial organization of different integer.
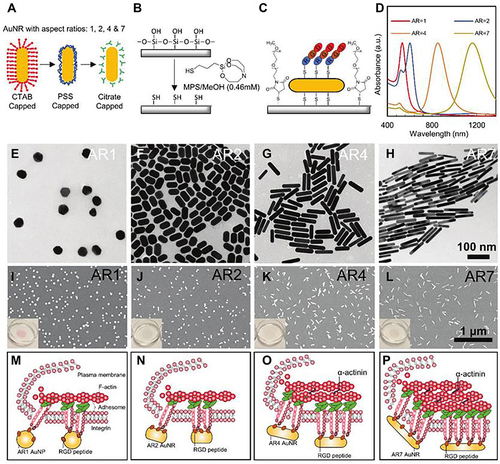
Figure 34 Schematic representation of the preparation of Au@PDA NPs nanoprobe and its application of real-time detecting the osteogenic differentiation in living hMSCs by intracellular detection of miRNAs. (A) Preparation of the Polydopamine-Coated Gold Nanoparticles (Au@PDA NPs) and Hairpin-DNA-Based (hpDNA) Nanoprobes. (B) Intracellular Detection of miRNAs in Living Human Mesenchymal Stem Cells.
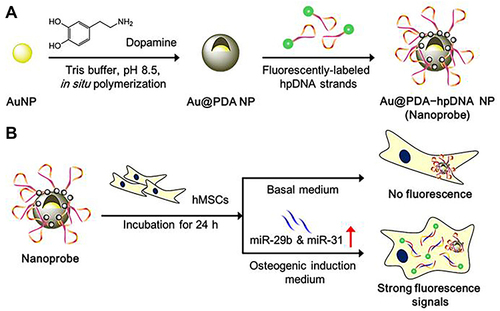
Figure 35 Detection strategy to monitor differentiation of mNSCs by the GO-encapsulated AuNPs substrate through the change of SERS signals.
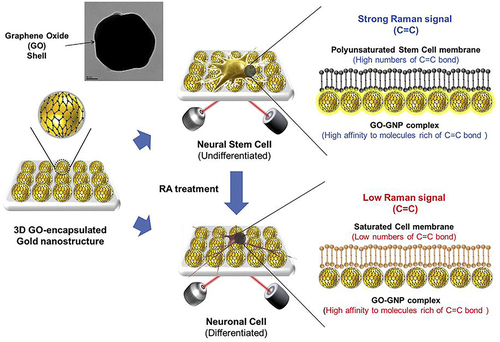
Figure 36 By controlling the arrangement of carbon nanotubes, hMSCs can grow and differentiate in the carbon nanotube network. (A) Schematic diagram showing the experimental procedure. (B) Plausible model to explain the hMSC responses to the aligned and the randomly oriented CNT networks.
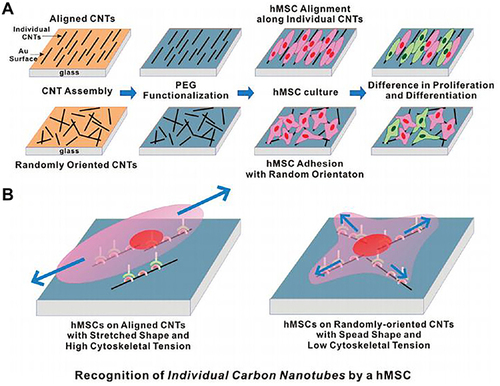
Figure 37 Schematic representation of using carboxylated MWCNTs to regulated the neural gene expression in hBMMSCs in the basal medium.
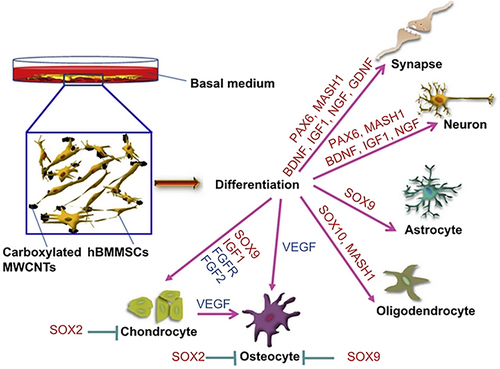
Figure 38 A summary of the biomedical applications map of inorganic nanoparticles, including the current research progresses in laboratories and challenges.