Figures & data
Figure 1 Schematic diagrams of w/o microemulsion, multiple emulsion and coated nanoemulsion respectively.
Abbreviations: w/o, water in oil; HLB, hydrophilic lipophilic balance.
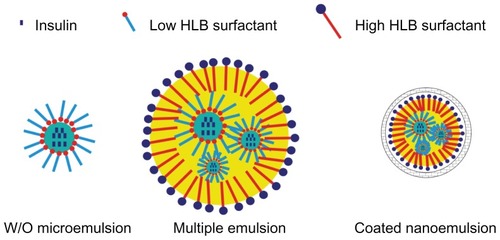
Table 1 Mean zeta potential values of different formulations to form Alg/Chit-coated nanoemulsion
Figure 2 The effects of Ca2+ (A), Chit (B) and Alg (C) concentration on particle size and entrapment ratio of coated nanoemulsion.
Notes: Mean ± SD, n = 3.
Abbreviations: Chit, Chitosan; Alg, Alginate.
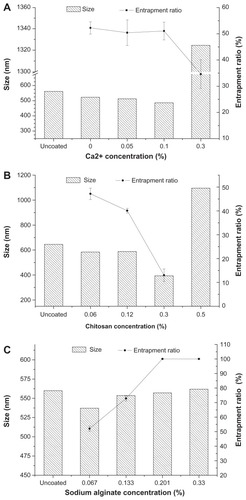
Table 2 Summary of formulation compositions for in vitro and in vivo study
Figure 3 Transmission electron microscopy photographs of uncoated nanoemulsion (A) and coated nanoemulsion (B).
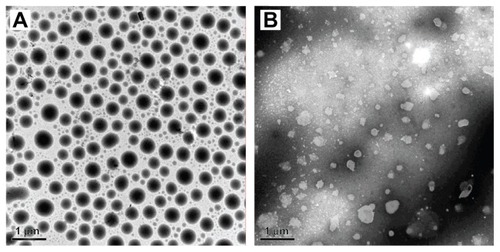
Figure 4 CD spectra of free insulin in solution, free insulin mixed with emulsion and insulin in Alg/Chit-coated nanoemulsion.
Abbreviations: CD, circular dichroism; Alg, Alginate; Chit, chitosan.
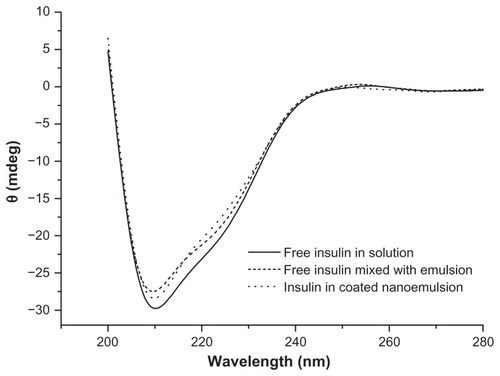
Figure 5 The insulin leakage from coated nanoemulsion in pH 1–3 simulated gastric juice.
Notes: Mean ± SD, n = 3.
Abbreviation: SD, standard deviation.
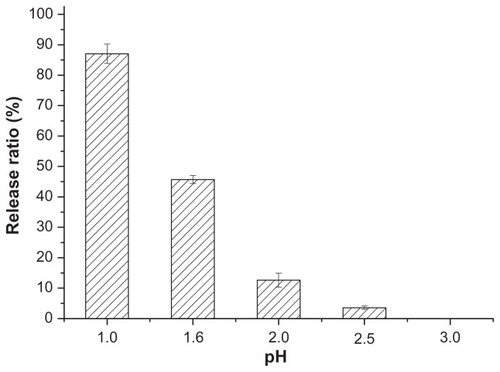
Figure 6 In vitro insulin release profile from Alg/Chit-coated nanoemulsion, uncoated nanoemulsion and multiple emulsion in simulated gastric juice (pH 2.5 media).
Notes: Mean ± SD, n = 3.
Abbreviations: Alg, Alginate; Chit, chitosan.
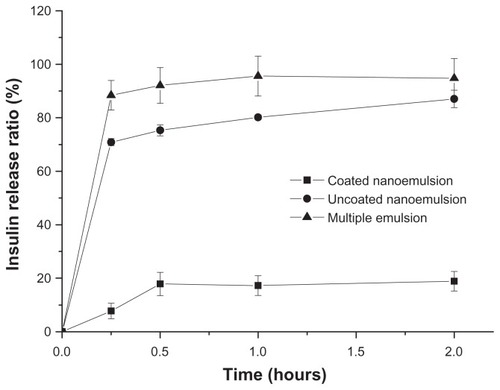
Figure 7 Plasma glucose level versus time profiles of Wistar rats after oral administration of 50 IU/Kg Alg/Chit-coated nanoemulsion, multiple emulsion, uncoated nanoemulsion, and insulin solution, compared to sc 1 IU/kg insulin.
Notes: Mean ± SD, n = 6; *P < 0.05 and **P < 0.01 compared with control group.
Abbreviations: Alg, Alginate; Chit, chitosan, sc, subcutaneous.
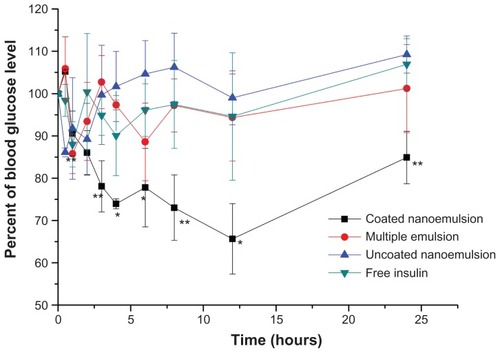
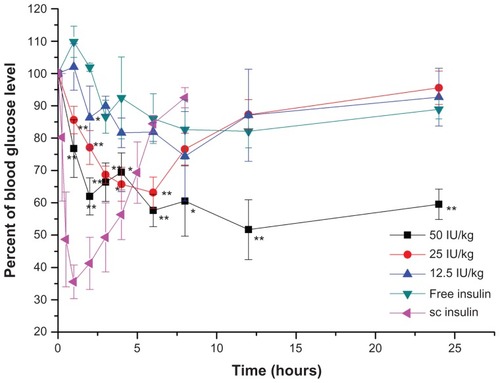
Figure 8 Plasma glucose level versus time profiles of Wistar rats after oral administration of Alg/Chit-coated nanoemulsion in 50 IU/kg, 25 IU/kg, 12.5 IU/kg and free insulin solution as control.
Notes: Mean ± SD, n = 6; *P < 0.05 and **P < 0.01 by comparing dosage 50 IU/kg with 12.5IU/kg; #P < 0.05 by comparing dosage 25 IU/kg with 12.5 IU/kg; ^P < 0.05 by comparing dosage 50 IU/kg with 25 IU/kg.
Abbreviation: sc, subcutaneous.
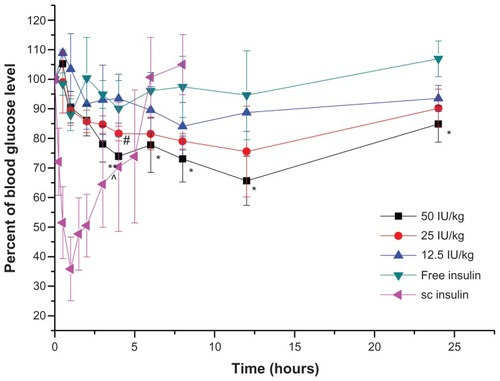
Figure 9 Plasma glucose level versus time profiles of GK rats after oral administration of free insulin solution, Alg/Chit-coated nanoemulsion 50 IU/kg, 25 IU/kg and 12.5 IU/kg, compared with sc 1 IU/kg insulin.
Notes: Mean ± SD, n = 6; *P < 0.05 and **P < 0.01 compared with control group.
Abbreviations: GK, Goto-Kakizaki; sc, subcutaneous.