Figures & data
Figure 1 Chemical structures of THD and TA.
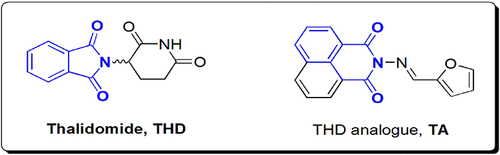
Table 1 Primers Sequences for qRT-PCR
Scheme 1 Synthesis of TA compound, where (i) represents N-aminonaphthalimide, (ii) represents Furan-2-carboxaldehyde, (iii) represents TA, EtOH is absolute ethyl alcohol and Ac2O is acetic anhydride.
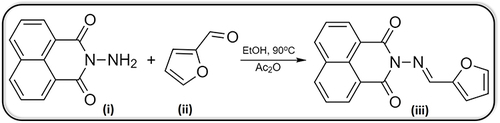
Figure 2 Pseudo-ternary phase diagram of the prepared plain NE consisting of oleic acid, Tween-80, n-propyl alcohol and water. The clear area under the curve shows the multiphase system, while the gray area under the curve shows the one phase system.
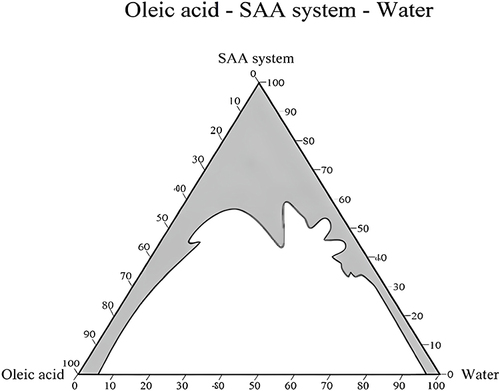
Figure 3 S1, S2 and S3 represent three prepared plain NE formulae. S1 represents the most stable formula as it showed clear transparent formula without any aggregations; S2 and S3 represent unstable formulae as they showed aggregations, phase separations and coagulations; TA-NE formula represents the prepared formula after a year of preparation showing a clear transparent formula.
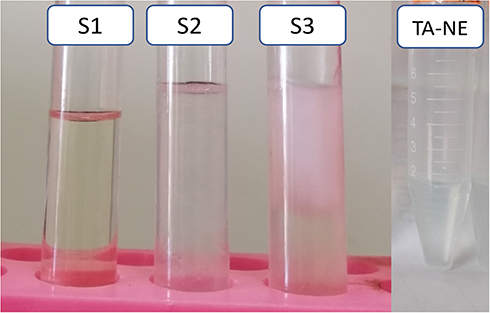
Figure 4 Field Emission Transmission Electron microscope photomicrographs. (A) Plain NE formula; (B) TA-NE formula.
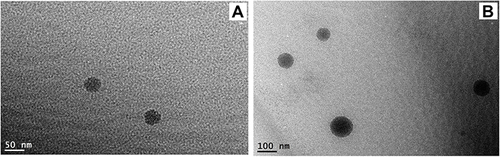
Figure 5 FTIR spectra of the plain NE and TA-NE formulae. The characteristics peak (C–H) stretching of the TA at 990–1045 cm−1, and the weak and broad peak at 1520 cm−1 characterizes the (C-O-H) of the alcohol are indicated by red eclipses.
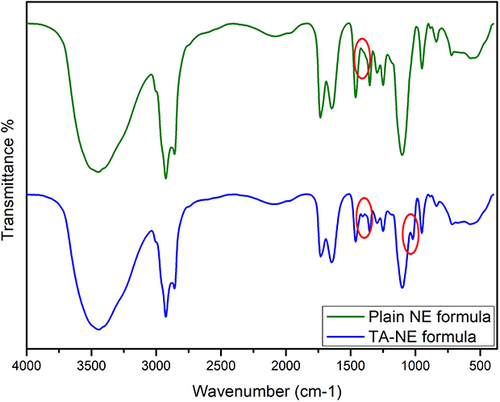
Figure 6 In vitro drug release study for TA from NE. It revealed that complete release was achieved within 48 h.
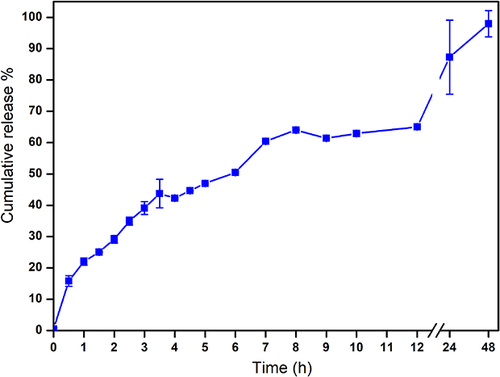
Table 2 Cytotoxicity Studies of TA and TA-NE Formula on Different Types of Cell Lines
Figure 7 Cytotoxicity study on MDA-MB-231 cell line representing the IC50 values. (A) Plain NE formula (49.42 ng/mL); (B) TA-NE formula (8.509 ng/mL).
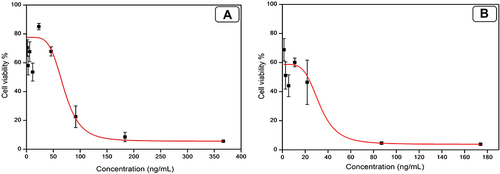
Figure 8 Cell cycle analysis of untreated MDA-MB-231 cell line (control) and treated MDA-MB-231 cell line with TA-NE formula. (A) The bar graph represents the percentage values of cells in each stage of cell cycle. TA-NE formula induced cell cycle arrest in the treated MDA-MB-231 cell line significantly in G2/M phase compared to that of untreated cells; (B) Untreated MDA-MB-231 cell line; (C) Treated MDA-MB-231 cell line with TA-NE formula.
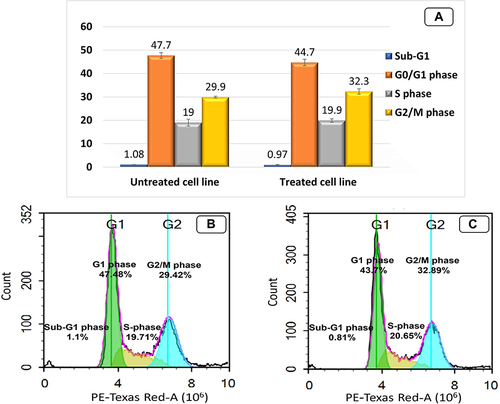
Figure 9 Annexin V apoptosis assay (A) Untreated MDA-MB-231 cell line; (B) Treated MDA-MB-231 cell line with TA-NE formula. Treated MDA-MB-231 cell line showed a significant increase in cell percentage in Q1 and Q2 representing necrotic and late apoptotic phases.
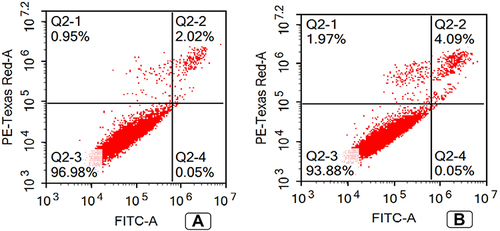
Figure 10 Gene expression analysis of TGF-β, MCL-1, VEGF, TNF-α, STAT3 and IL-6 in untreated (control) MDA-MB-231 cell line and TA-NE formula treated MDA-MB-231 cell line. TA-NE formula downregulated the expression levels of TGF-β, MCL-1, VEGF, TNF-α, STAT3 and IL-6 by 2.22, 2.33, 4, 3.4, 2.4 and 4.5 folds, respectively. Data are presented as mean ± standard deviation. Significantly (*p ˂ 0.05, **p ˂ 0.01, ***p ˂ 0.0001).
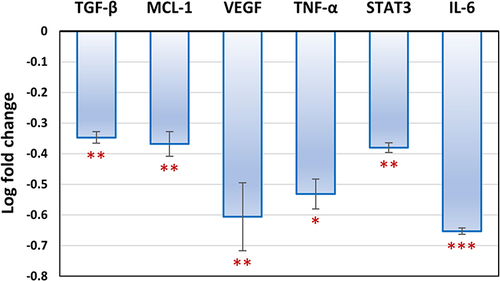
Figure 11 Validation process for docking (WFE, RO4, 3SR and BAX) into (A) AKT Kinase; (B) MMP1; (C) ALDH1; (D) VEGF, respectively. Co-crystallized ligand with green colour and the docked molecule with yellow colour.
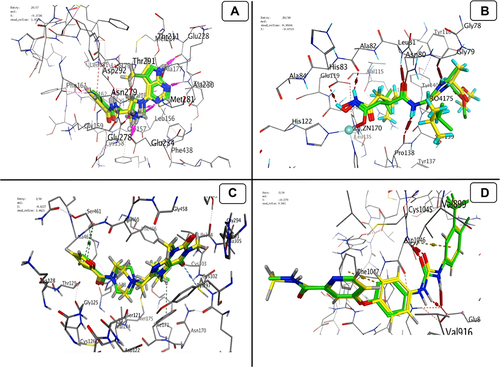
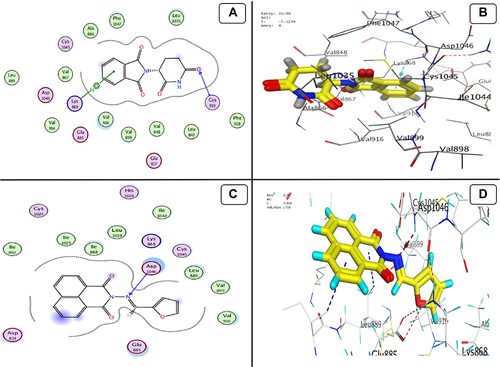
Figure 12 Docking model (A) 2D of THD fits into the ATP-binding site of Akt Kinase; (B) 3D of THD fits into the ATP-binding site of Akt Kinase; (C) 2D of TA fits into the ATP-binding site of Akt Kinase; (D) 3D of TA fits into the ATP-binding site of Akt Kinase.
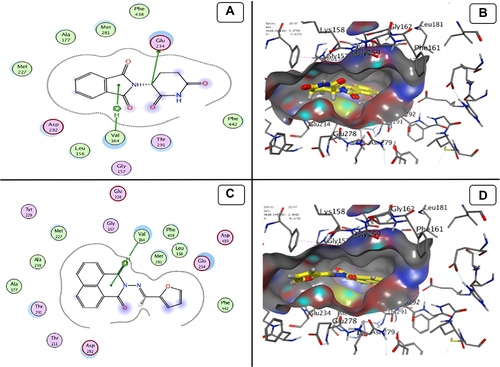
Figure 13 Docking model (A) 2D of THD fits into binding site of MMP-1; (B) 3D of THD fits into binding site of MMP-1; (C) 2D of TA fits into binding site of MMP-1; (D) 3D of TA fits into binding site of MMP-1.
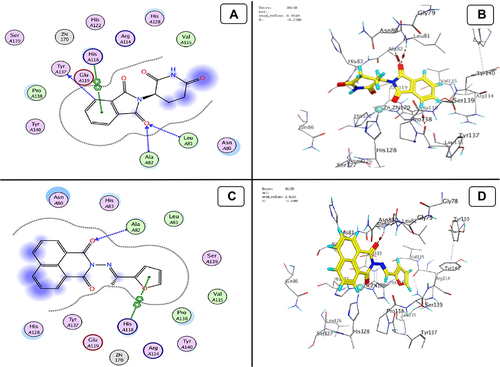
Figure 14 Docking model (A) 2D of THD fits into binding site of ALDH1; (B) 3D of THD fits into binding site of ALDH1; (C) 2D of TA fits into binding site of ALDH1; (D) 3D of TA fits into binding site of ALDH1.
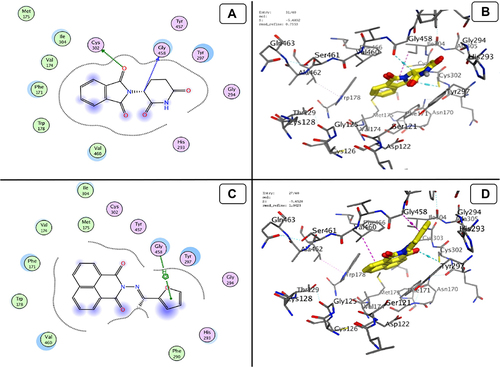
Figure 15 Docking model (A) 2D of THD fits into binding site of VEGF; (B) 3D of THD fits into binding site of VEGF; (C) 2D of TA fits into binding site of VEGF; (D) 3D of TA fits into binding site of VEGF.