Figures & data
Figure 1 Characterization of CBC-MCC@hMSN(SM) complex formulation. (A) TEM images of hMSN, hMSN(SM), MCC@hMSN(SM), CBC@hMSN(SM), and CBC-MCC@hMSN(SM) complex formulations and their magnified TEM images. (B) Nitrogen adsorption-desorption isotherms of hMSN, hMSN(SM), MCC@hMSN(SM), CBC@hMSN(SM), and CBC-MCC@hMSN(SM) complex formulations. The adsorbed volume against relative pressure plot was used to calculate the specific surface area in the relative pressure (P/P0) ranging from 0.04 to 0.1 by BET model, the pore size distribution and pore volume by BJH model, and the total pore volumes (Vt) based on the adsorbed N2 amount at the P/P0 of 0.995. The pore size against dV/dlog plot was used to determine the effects of CBC or MCC loading on the pore size distribution. (C) In vitro cumulative release curves of MCC or CBC from MCC@hMSN(SM), CBC@hMSN(SM), and CBC-MCC@hMSN(SM) complex formulations. The results were shown as mean ± SD (n = 4).
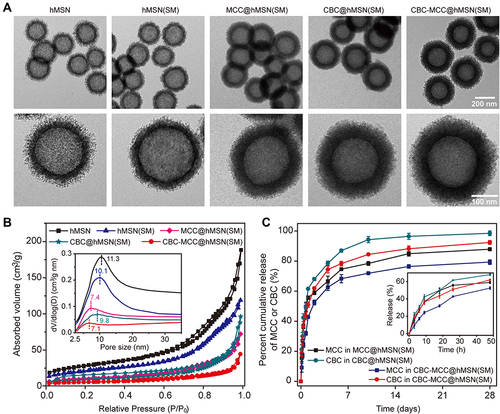
Table 1 Encapsulation Efficiency and Drug Loading Efficiency of MCC and CBC
Figure 2 hMSN(SM) nanocarrier has no obvious cytotoxicity and tissue toxicity. (A–D) Relative cell viability of HRVECs or RF/6A cells incubated with PBS (Ctrl), or 0.1, 1, 10, 100, and 1000 µg/mL of hMSN(SM) for 24 h or incubated with 1 µg/mL and 10 µg/mL of hMSN(SM) for 24 h, 48 h, and 72 h. MTT assays were conducted to detect cell viability (n = 4; One-way ANOVA test). (E and F) H&E staining and quantitative analysis was conducted to detect the change of retinal thickness after intravitreal injection of 1 μg/mL, 10 μg/mL, 100 μg/mL of hMSN(SM) or left untreated (Ctrl) for 30 days (n = 5; Kruskal–Wallis test). (G and H) TUNEL staining and ELISA assays of the retinas of C57BL/6J mice after an intravitreal injection of 1 μg/mL, 10 μg/mL, 100 μg/mL hMSN(SM) or left untreated (Ctrl) for 30 days. TUNEL staining was conducted to detect retinal apoptosis ((G), n = 5). ELISA assays were conducted to detect the expression change of ICAM-1, MCP-1, VEGF, and IL-6 ((H), n = 5, Mann–Whitney U-test).
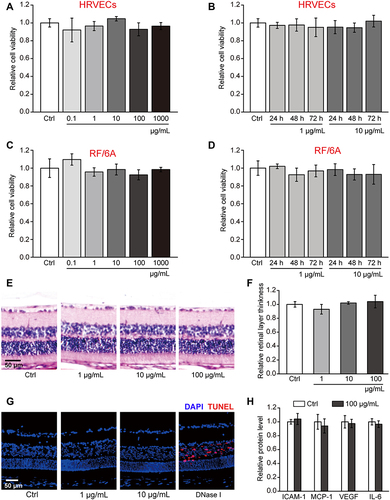
Figure 3 CBC-MCC@hMSN(SM) complex formulation suppresses angiogenic effects in endothelial cells (A) The viability of HRVECs incubated with VEGF (10 ng/mL) without or with hMSN(SM) (5 μg/mL), CBC (10 μg/mL), MCC (5 μg/mL), CBC@hMSN(SM) (CBC: 10 μg/mL), MCC@hMSN(SM) (MCC: 5 μg/mL), or CBC-MCC@hMSN(SM) (CBC: 10 μg/mL, MCC: 5 μg/mL) for 24 h, 48 h, and 72 h. Cell viability was detected by MTT assays (n = 4, One-way ANOVA followed by Bonferroni test). (B–D) Representative images and quantitative results of cell proliferation (B), cell migration (C), and tube formation (D) of HRVECs treated as shown in for 72 h (n = 4, One-way ANOVA followed by Bonferroni test). VEGF-treated HRVECs were taken as the control group (Ctrl). *P < 0.05 vs Ctrl; #P < 0.05 vs CBC-MCC@hMSN(SM).
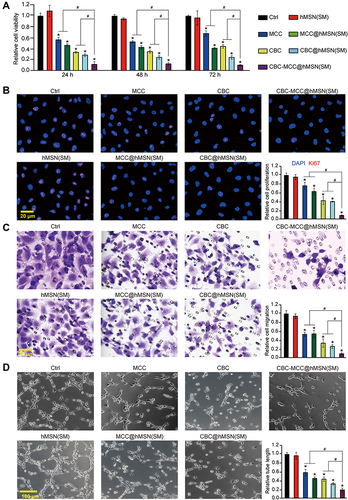
Figure 4 CBC-MCC@hMSN(SM) complex formulation suppresses LPS-induced inflammatory responses in endothelial cells. (A–H) HRVECs were cultured in the serum-starved condition for 1 h, and then incubated with LPS (100 ng/mL) without or with hMSN(SM) (5 μg/mL), CBC solution (10 μg/mL), MCC solution (5 μg/mL), CBC@hMSN(SM) (CBC: 10 μg/mL), MCC@hMSN(SM) (MCC: 5 μg/mL), or CBC-MCC@hMSN(SM) (MCC: 5 μg/mL, CBC: 10 μg/mL) for 24 h, 48 h, and 72 h. qRT-PCR and ELISA assays were conducted to detect the expression of VEGF, ICAM-1, MCP-1, and IL-6 (n = 4, One-way ANOVA followed by Bonferroni test). *P < 0.05 vs Ctrl; #P < 0.05 vs CBC-MCC@hMSN(SM).
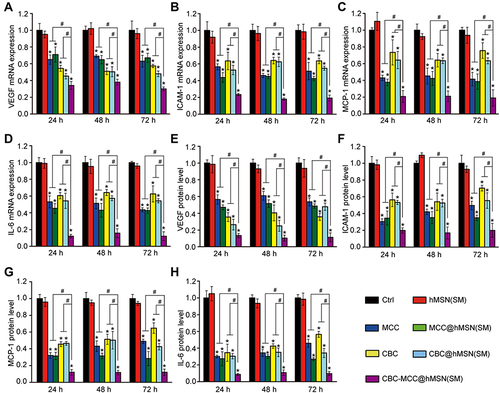
Figure 5 CBC-MCC@hMSN(SM) complex formulation suppresses CNV formation and CNV-related inflammatory responses. (A and B) Percentage of the retaining MCC (a) and CBC (B) in the retinas of C57BL/6J mice at day 0 and 30 after intravitreal injections of 1 μL of CBC-MCC@hMSN(SM) complex (MCC: 5 mg/mL, CBC: 10 mg/mL) or an equivalent dose of MCC or CBC solution (n = 5). The amounts of MCC or CBC in the retinas at day 0 (injection date) were set as 100%. (C) Representative images of RPE/choroid complexes stained by Isolectin-B4 at day 21 after laser injury and the change of neovascular regions (n = 5) at day 14 and 21 after laser injury. (D–K) mRNA and protein expression levels of ICAM-1, MCP-1, VEGF, and IL-6 in RPE/choroid complexes detected by qRT-PCR and ELISA assays (n = 5). Kruskal–Wallis test; *P < 0.05 vs Ctrl; #P < 0.05 vs CBC-MCC@hMSN(SM).
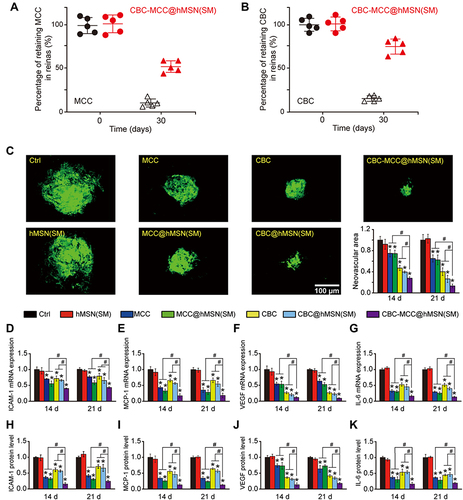
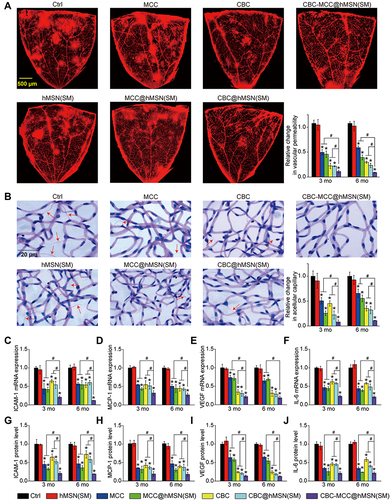
Figure 6 CBC-MCC@hMSN(SM) complex formulation suppresses diabetes-induced retinal vascular dysfunction and inflammatory responses (A) Representative images of flat-mounted retinas stained by Evans blue at month 6 and relative change of retinal vascular permeability at month 3 and 6 (n = 5) in diabetic C57BL/6J mice after intravitreal injections of 1 µL of PBS (Ctrl), hMSN(SM) (5 mg/mL), MCC (5 mg/mL), MCC@hMSN(SM) (MCC: 5 mg/mL), CBC (10 mg/mL), CBC@hMSN(SM) (CBC: 10 mg/mL), or CBC-MCC@hMSN(SM) (MCC: 5 mg/mL, CBC: 10 mg/mL). (B) Retinal trypsin digestion was conducted to detect the number of acellular retinal capillaries (red arrows). Acellular capillaries were stained with PAS (Periodic Acid-Schiff)/hematoxylin and quantified in 30 random fields per retina and averaged (n = 5). (C–J) The expression levels of ICAM-1, MCP-1, VEGF, and IL-6 in the retinas were detected by qRT-PCR and ELISA assays (n = 5). Kruskal–Wallis test; *P < 0.05 vs Ctrl; #P < 0.05 vs CBC-MCC@hMSN(SM).