Figures & data
Figure 1 Cytotoxicity of ZnO QDs against SMMC-7721 cells after 24 h exposure. Cell viability was determined by CCK-8 assay and calculated relative to negative controls. All data are presented as mean ± SEM (n = 3). *p < 0.05, and ***p < 0.001 versus control according to ANOVA followed by Dunnett’s test.
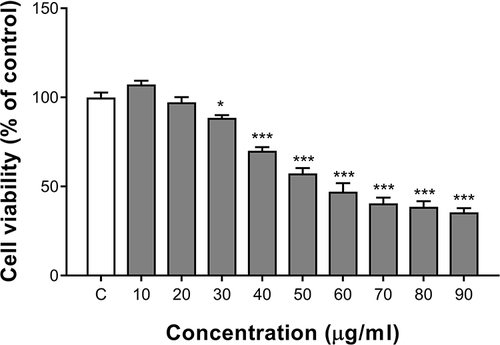
Figure 2 Discrimination plots of control and ZnO QDs-treated cells from the PCA of UPLC-MS/MS data: (A) positive mode, (B) negative mode.
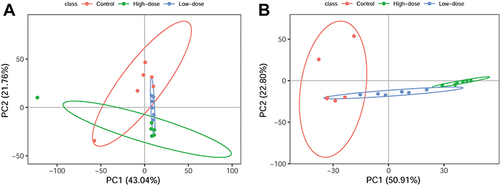
Table 1 Overlap of Significantly Changed Metabolites Between Different Dosage of ZnO QDs and Controls
Figure 3 Metabolic profiles of the different ZnO QDs doses and controls at 24 h. (A–D) score plots of the PCA model, (E–H) score plots of the PLS-DA model, (I–L) plot of the permutation test (200 times) of the PLS-DA model.
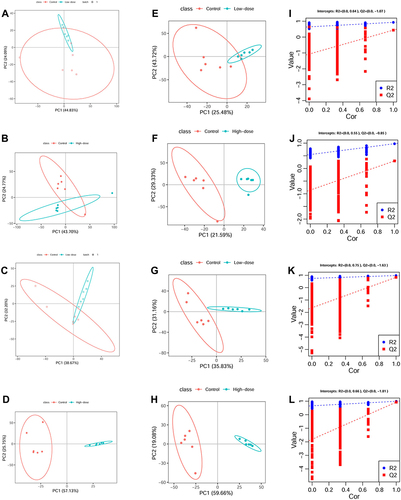
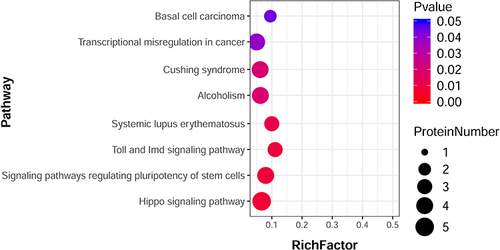
Figure 4 Scatterplot of significantly enriched KEGG pathways based on the differential metabolites induced by 20 µg/mL ZnO QDs (data obtained in positive mode UPLC-MS/MS). The size of the dots represents the number of metabolites.
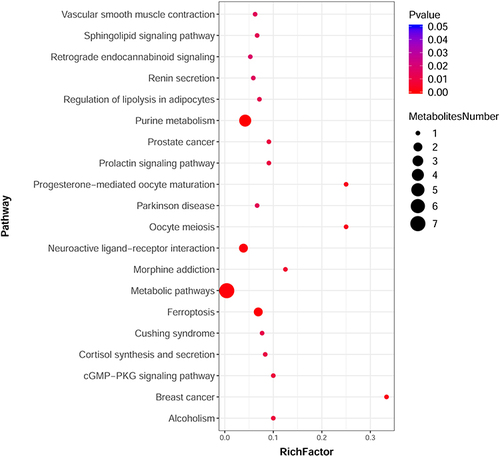
Table 2 Significantly Differentially Expressed Proteins Induced by ZnO QDs
Figure 5 Scatterplot of significantly enriched KEGG pathways based on differential proteins induced by 20 µg/ mL ZnO QDs. The size of the dots represents the numbers of proteins.