Figures & data
Figure 1 Schematic of positively charged (AmS-IONPs) and negatively charged (COOH-AmS-IONPs) nanoparticles and their physical properties.
Notes: Measurements were performed in triplicate samples using a Nano-partica SZ-100 series instrument from Horiba. Values represent the mean ± standard error of the mean (n = 3).
Abbreviation: AmS-IONPs, aminosilane-coated iron oxide nanoparticles.
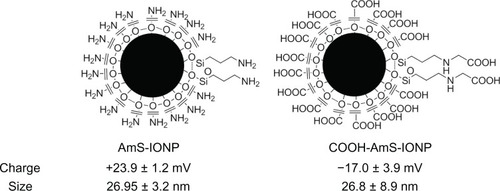
Figure 2 bEnd.3 cell (A), astrocyte (B), and neuron (C) viability following a 24-hour exposure to various concentrations of AmS-IONPs.
Notes: Iron content was used to normalize the concentration of various formulated IONPs. Values represent the mean ± standard error of the mean of three samples per treatment group. *Indicates P < 0.05 compared to control; **indicates P < 0.01.
Abbreviation: AmS-IONPs, aminosilane-coated iron oxide nanoparticles.
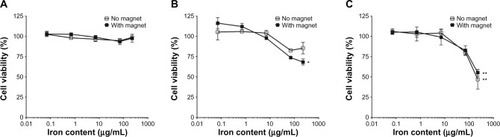
Figure 3 MTT assay of COOH-AmS-IONPs to bEnd.3 cells (A), astrocytes (B), and neurons (C).
Notes: Iron content was used to normalize the concentration of various formulated IONPs. Values represent the mean ± standard error of the mean of three samples per treatment group. ***Indicates P < 0.001 compared to control; +indicates P < 0.05 compared to the same concentration without a magnet.
Abbreviations: MTT, 3-(4,5-dimethylthiazol-2-yl)-2,5-diphenyltetrazolium bromide; AmS-IONPs, aminosilane-coated iron oxide nanoparticles.
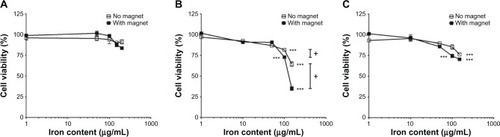
Figure 4 Cellular uptake of AmS-IONPs in bEnd.3 cells. Amount of iron accumulation in the cells normalized to protein in time- and concentration-dependent manner (A). The cells were incubated with AmS-IONPs for 1.5 hours at 37°C (B) or 4°C (C).
Note: Values represent the mean ± standard error of the mean of three samples per treatment group.
Abbreviation: AmS-IONPs, aminosilane-coated iron oxide nanoparticles.
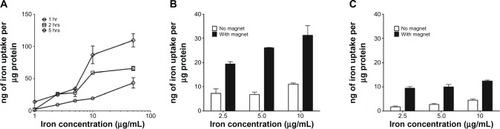
Figure 5 Cellular uptake of AmS-IONPs and COOH-AmS-IONPs in bEnd.3 cells (A), astrocytes (B), and neurons (C) at 37°C.
Note: Values represent the mean ± standard error of the mean of three samples per treatment group.
Abbreviation: AmS-IONPs, aminosilane-coated iron oxide nanoparticles.
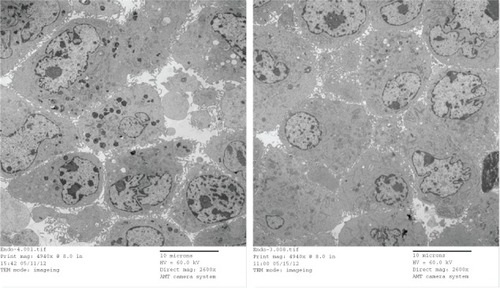
Figure 6 TEM images of bEnd.3 cells that were incubated with AmS-IONPs (left) or COOH-AmS-IONPs (right).
Note: Electron-dense particles are visible in intracellular vesicles.
Abbreviations: TEM, transmission electron microscopy; AmS-IONPs, aminosilanecoated iron oxide nanoparticles.
