Figures & data
Figure 1 The schematic diagram delineates how CD-PEI-DOX-siMRP1 delivers doxorubicin to tumors and antagonizes chemoresistance by hindering drug efflux through knocking down MRP1 expression.
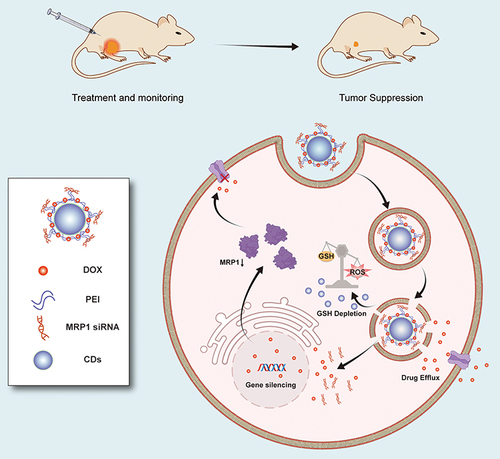
Figure 2 The characteristics of CD-PEI and CD-PEI-DOX-siMRP1.
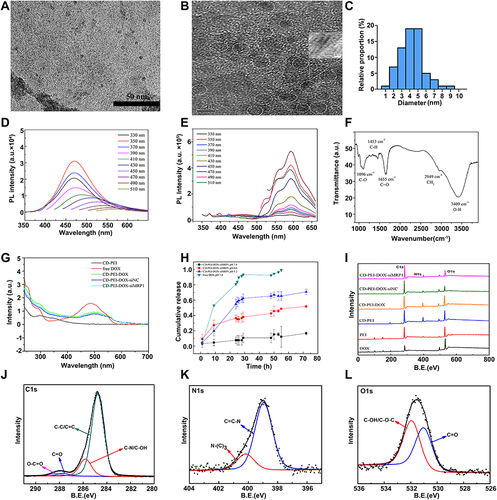
Table 1 Percentage of Groups Obtained from Curve Fitting the C1s and N1s Peaks of Nanodrug
Figure 3 CD-PEI catalyzes the oxidation of GSH and increase of ROS in cells.
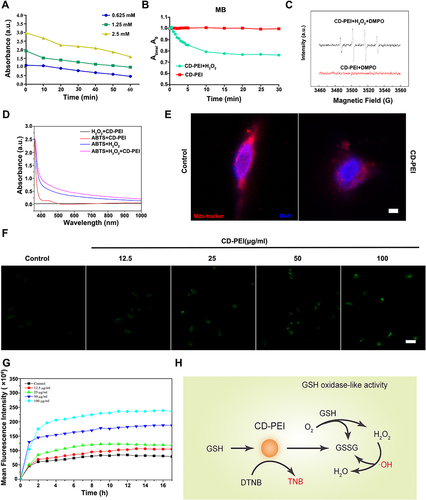
Figure 4 The uptake of cells treated with indicated drugs detected by laser confocal scanning microscopy.
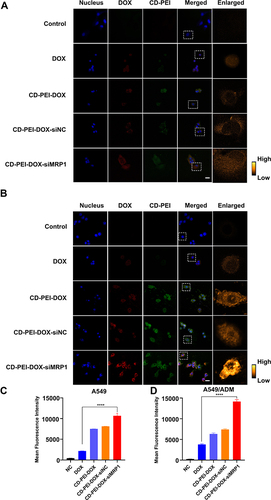
Figure 5 Uptake of drugs in A549 and A549/ADM cells were determined using flow cytometry.
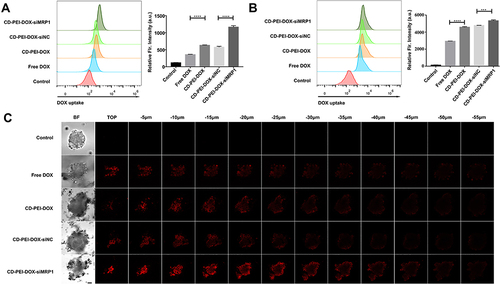
Figure 6 CD-PEI-DOX-siMRP1 inhibits the expression of MRP1 and causes inhibition of proliferation in lung cancer cells.
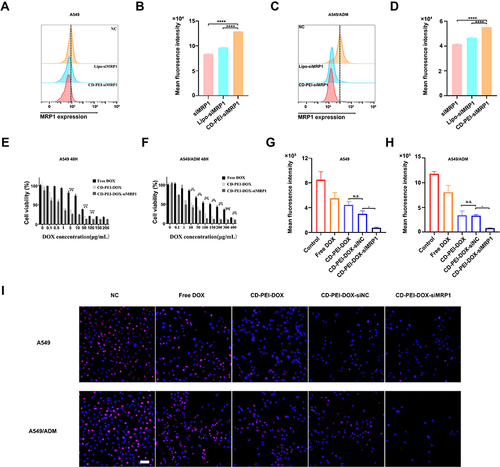
Table 2 IC50 of Free DOX, CD-PEI-DOX, CD-PEI-DOX-siMRP1 in A549 and A549/ADM Cells
Figure 7 Analysis of targeting and tumor-inhibitory effect of nanodrugs.
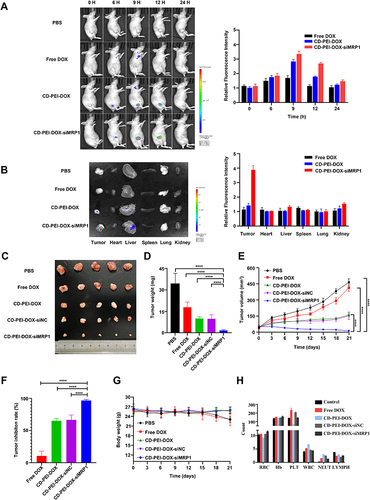
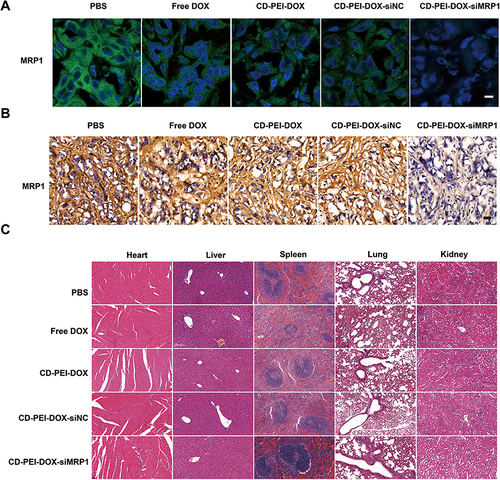
Figure 8 The effect of different drugs on MRP1 expression and tissue integrity on mouse models.