Figures & data
Figure 1 Physicochemical characterization of GDYO. (A) AFM images of GDYO. (B) TEM images of GDYO. (C) XPS survey scan and (D) C 1s spectra of GDYO. (E) Raman spectra of GDYO. (F) FTIR spectra of GDYO.
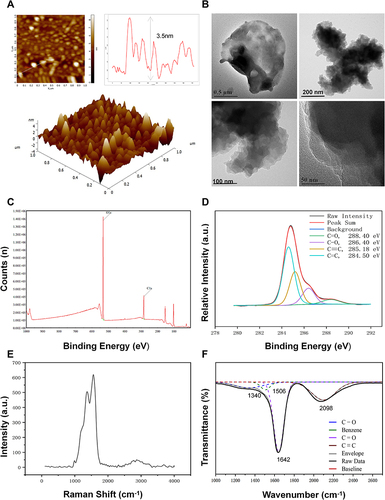
Figure 2 In vitro anticancer efficacy. (A) Antitumor effects of GDYO-PDT in SCC9 cells stained with PI (red, dead cells) and calcein AM (green, live cells), respectively. Fluorescent images were obtained by fluorescence microscopy. Scale bar = 100 nm. (B) Relative fluorescence quantitative analysis of live/dead fluorescence microscopy. (C) Cell viability of GDYO at different concentrations in the NOK normal cell line. (D) Cell viability of SCC9 cells incubated with GDYO at different concentrations under irradiation. (E) Confocal microscopic images of SCC9 cells after exposure to GDYO for 6 h. Scale bar = 15 μm. **P <0.01, ***P <0.001, ****P <0.0001.
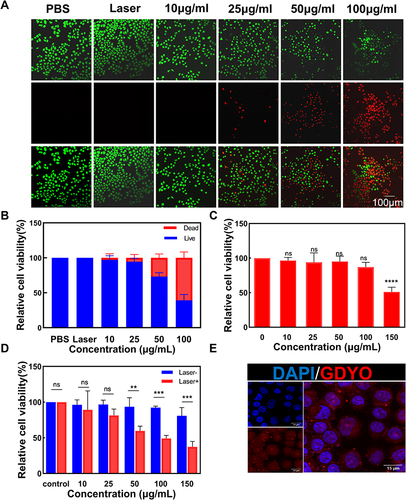
Figure 3 GDYO-based PDT enhances cells stiffness and modulates cellular morphology. (A) Morphological features of contact-mode AFM observed in the control (B) and SCC9 cells treated with the GDYO and laser. (C) and (D) Relative stiffness determined by quantitative analysis of the Young’ s modulus of cells.**P <0.01, ***P <0.001, ****P <0.0001.
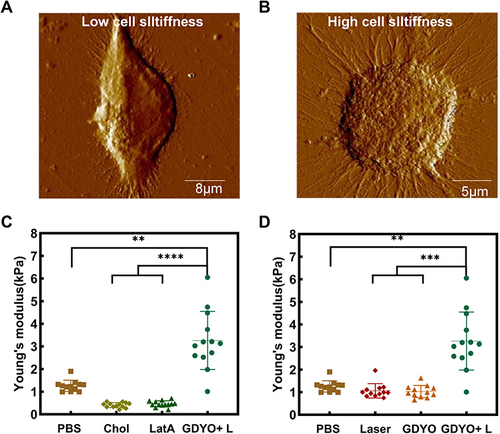
Figure 4 Membrane lipid rafts and F-actin of cancer cells. (A) AF488-CTB-tagged membrane lipid rafts and DAPI-stained nucleus were visible to CLSM, scale bar = 20 μm. (B) SCC9 cells show an increased F-actin polymerization as shown in the fluorescence images. Scale = 15 μm.
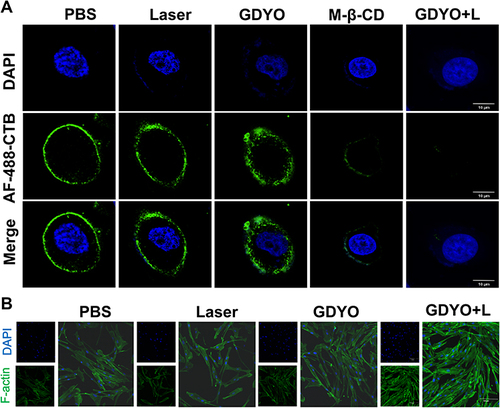
Figure 5 PDT enhances T lymphocytes activity. (A) Schematic illustration of the in vitro co-culture process of pre-treated SCC9 cells and activated T cells. (B) Activated CD8 T cells were co-cultured with PBS-treated, cholesterol-treated, GDYO-treated, GDYO-laser-treated and GDYO-laser-cholesterol-treated SCC9 cells (E:T ratio = 1:1, 5:1, 10:1, 20:1). Supernatant was used for LDH releasing assay. (C) The cell death mechanism was determined by assaying for apoptosis using an Annexin V-FITC/PI apoptosis kit (E:T ratio = 10:1). The release of (D) TNF-α and (E) IFN-γ cytokines production in the supernatant of the co-culture assay (E:T ratio=10:1) were detected using ELISA. *P <0.05, **P <0.01, ***P <0.001.
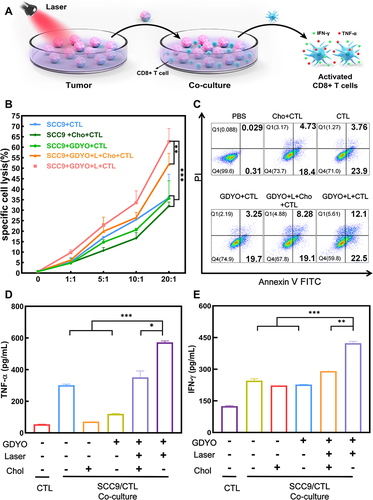
Figure 6 In vivo antitumor and therapeutic evaluation of GDYO. (A) Schematic illustration of the in vivo process. (B) Body weight variation in mice following various treatments. (C) Relative tumor volume study after multiple treatment. Tumor form (D) and weight (E) during treatment in each group. **P <0.01, ***P <0.001, ****P <0.0001.
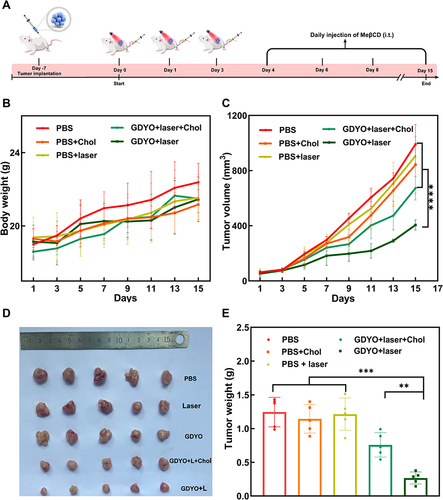
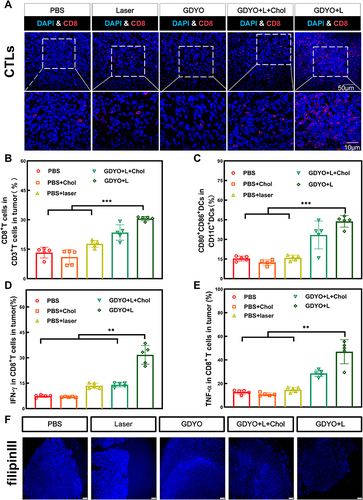
Figure 7 Assessment of intratumoral immune responses in vivo. (A) Representative immunofluorescent infiltration images of CD8+ T cells in tumor sections of diverse groups. (B) Tumor mass normalized intratumoral infiltration of CD8+ T cells. (C) DC maturation ratio in the LNs. (D) and (E) Expression analysis of IFN-γ+ CD8+ T cells and TNF-α+ CD8+ T cells in tumor tissues following different treatments. (F) Tumor tissues after different treatments were stained with Filipin III (shown in blue color). Scale bar =100 μm. **P <0.01, ***P <0.001.