Figures & data
Figure 1 Schematic of the Achilles tendon laceration repair. (A) A incision was made longitudinally along the Achilles tendon. (B) After excising the accessory tendon, the Achilles tendon was transected completely at 5 mm proximal to its insertion into the calcaneus of the foot. (C) The injured tendon was sutured. (D) A second transection was made in the tendon 3 mm proximal to the suturing site to reduce tensile forces across the repair site. (E) Before the skin was closed, 50 µL of the PDA NPs solution (10 mg/mL) was administrated around the suturing site in the photothermal group and the PDA NPs group, whereas 50 µL of PBS was used in the control group. (F) The skin was then closed.
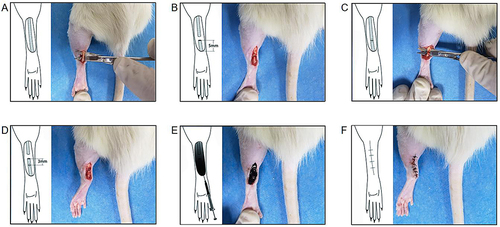
Figure 2 The characterization and photothermal effect of polydopamine nanoparticles (PDA NPs). (A) TEM image of PDA nanoparticles. (B) UV absorption spectrum of PDA nanoparticle solution. (C) The temperature increment of PDA nanoparticle solution with different concentration. (D) The temperature increment of PDA nanoparticle solution with different laser power density. (E) The heating and cooling curve of PDA nanoparticle solution. (F) The calculation of photothermal conversion efficiency. (G) The temperature increment of PDA nanoparticle solution (10 mg/mL) under the laser power density of 0.48 W/cm2. (H-J) Thermal images of skin temperature on the surface of the Achilles tendon under different conditions.
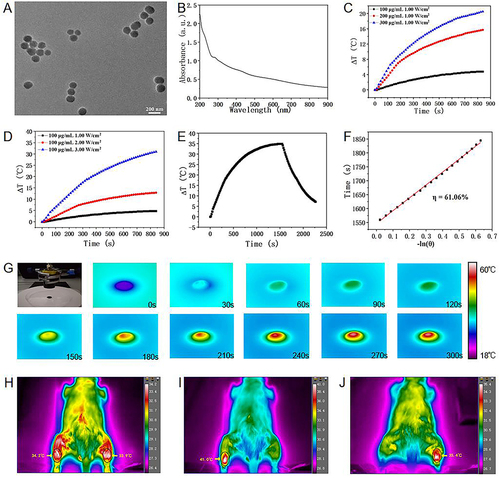
Figure 3 Polydopamine nanoparticles-based photothermal effect did not affect tendon healing. (A) The load of tendon rupture at two weeks after surgery. (B) The load of tendon rupture at six weeks after surgery. The bars represent mean ± SEM (n = 3 per group). ns, not significant.
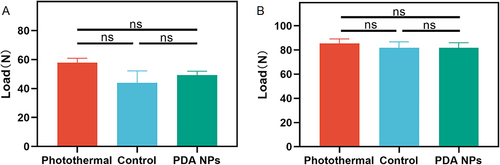
Figure 4 Histological assessment on adhesion formation (40 ×). (A) In the photothermal group, there is an interval between the skin (S) and the repaired tendon (T) at the repair site (Arrowhead), but the interval disappeared and was filled by dense scar in the control group (B) and the PDA NPs group (C). (D) Average adhesion score in the photothermal group is significantly lower than that in the control group and the PDA NPs group. The data is expressed by mean ± SEM (one-way ANOVA, p = 0.002; n = 5 per group). ** p < 0.01; ns, no significant.
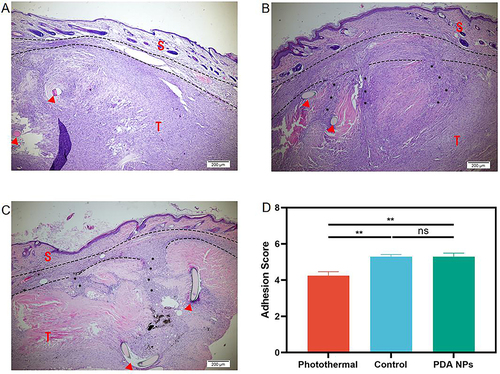
Figure 5 The Hsp 72 expression in the repaired tendons was measured by immunohistochemistry (n = 5 per group) and Western blot (n = 4 per group) at two weeks after surgery. (A) Immunohistochemical evaluation of Heat shock protein (Hsp) 72 (400 ×). (B) Average Hsp 72 in the photothermal group increases significantly compared with the other two groups (mean ± SEM; one-way ANOVA, p = 0.004; n = 5 per group). (C) Western blot of Heat shock protein (Hsp) 72. (D) Average Hsp 72 in the photothermal group increases significantly relative to the other two groups (mean ± SEM; one-way ANOVA, p = 0.002; n = 4 per group). * p < 0.05; ** p < 0.01; ns, no significant.
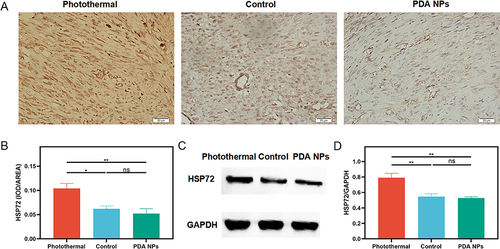
Figure 6 The JNK and p–JNK expression in the repaired tendons was measured by Western blot (n = 4 per group) at two weeks after surgery. (A and C) Western blot of Jun N-terminal kinase (JNK) and phospho-JNK (p-JNK). (B) There is no significant difference in JNK across three groups (mean ± SEM; one-way ANOVA, p = 0.303; n = 4 per group), (D) but p-JNK in the photothermal group decreases significantly (mean ± SEM; one-way ANOVA, p = 0.001; n = 4 per group). * p < 0.05; ** p < 0.01; ns, no significant.
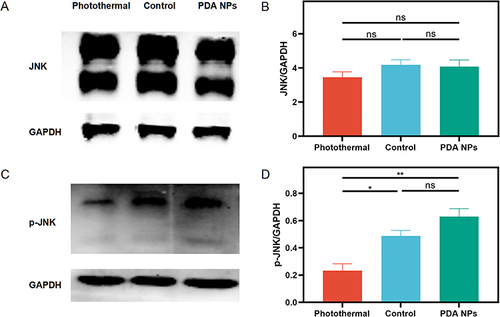
Figure 7 The α-SMA expression in the repaired tendons was measured by immunohistochemistry (n = 5 per group) and Western blot (n = 4 per group) at two weeks after surgery. (A) Immunohistochemical evaluation of α- smooth muscle actin (α-SMA) (400 ×). (B) Average α-SMA in the photothermal group decreases significantly compared with the other two groups (mean ± SEM; one-way ANOVA, p = 0.001; n = 5 per group). (C) Western blot of α-SMA. (D) Average α-SMA in the photothermal group decreases significantly relative to the other two groups (mean ± SEM; one-way ANOVA, p = 0.011; n = 4 per group). * p < 0.05; ** p < 0.01; ns, no significant.
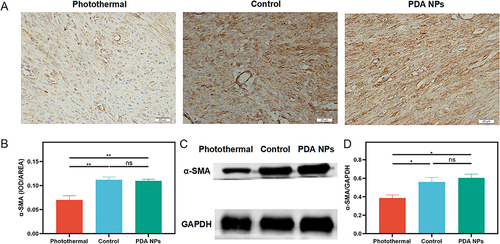
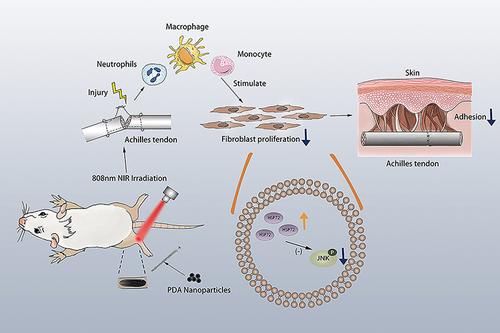
Figure 8 A possible mechanism of action of photothermal effect against adhesion formation after tendon injury.