Figures & data
Figure 1 Schematic illustration of biocompatible and double-triggering Fe3O4/DOX@CNS nanosystem for combined chemo-PTT synergistic therapy and MR imaging monitoring.
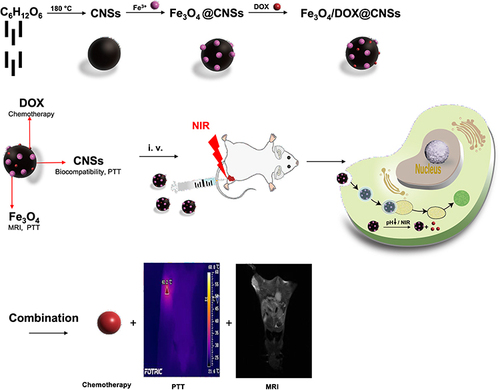
Figure 2 (a) TEM images of Fe3O4@CNSs. (b) XRD patterns of the CNSs and Fe3O4@CNSs. (c) Magnetic hysteresis loops and saturation magnetizations of Fe3O4 and Fe3O4@CNSs.
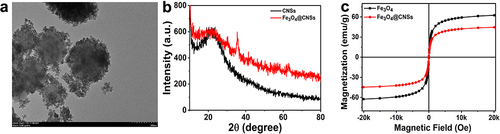
Figure 3 (a) Zeta potential of Fe3O4@CNSs, and Fe3O4/DOX@CNSs. (b) FTIR spectra of CNSs, Fe3O4@CNSs, and Fe3O4/DOX@CNSs. (c) Sizes of CNSs and Fe3O4/DOX@CNSs. (d) Induced release of DOX from Fe3O4/DOX@CNSs under various pH levels (pH=7.4 and 5.0) and NIR irradiation.
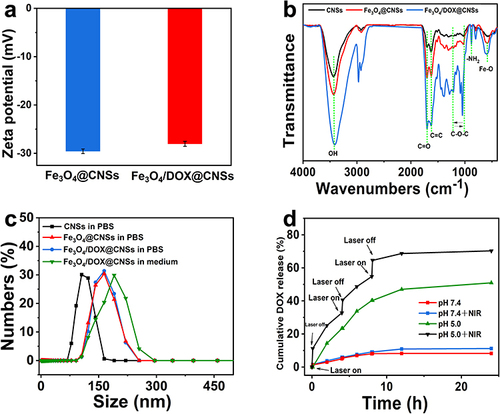
Figure 4 MCF-10A (a) and 4T1 (b) cell lines incubated with Fe3O4@CNSs at different concentrations (0, 50, 100, 150, and 200 µg/mL) for various durations (12, 24, 36, and 48 h). (c) In vitro cytotoxicity of Fe3O4@CNSs, Fe3O4@CNSs + NIR, Fe3O4/DOX@CNSs, pure DOX, and Fe3O4/DOX@CNSs + NIR against 4T1 cells after 24 h of incubation.
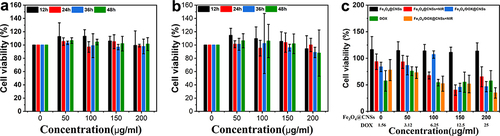
Figure 5 (a) Cellular pre- and post-uptake of Fe3O4/DOX@CNSs by MCF-10A, macrophages and 4T1 cells. (b) Linear relationship of r2 (1/T2) values vs concentration of Fe3O4/DOX@CNSs.
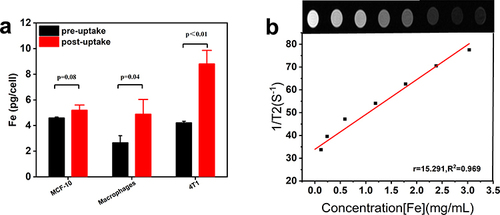
Figure 6 (a) Infrared thermal images of NS and Fe3O4/DOX@CNSs. (b) The temperature change of Fe3O4/DOX@CNSs solution (100 mg/mL) after turning cycling the laser four times. (c) Thermographs of the tumor region after intravenous injection with NS and Fe3O4/DOX@CNSs. (d) Heating curve of the various groups.
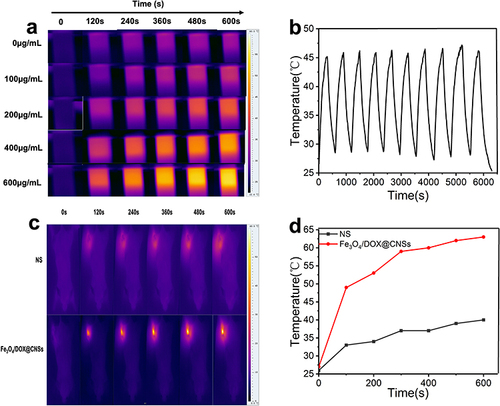
Figure 7 In vivo T2 MRI of 4T1 tumor-bearing mice at different time intervals (0, 3, 12, 24, 48 and 72 h) after injection with Fe3O4/DOX@CNSs (4 mg Fe/kg).
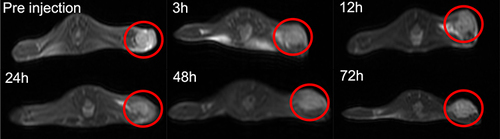
Figure 8 (a) Blood circulation and (b) biodistribution of Fe3O4/DOX@CNSs observed after intravenous injection in mice. Fe concentration measurements were performed by ICP- MS. (c) Pharmacokinetic of free DOX and Fe3O4/DOX@CNSs after a single dosage intravenous to rat.
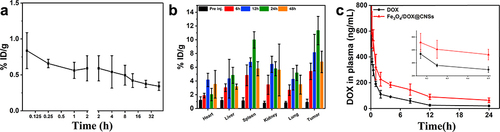
Table 1 Pharmacokinetic Parameters of DOX and Fe3O4/DOX@CNSs After a Single Dosage Intravenous to Rat
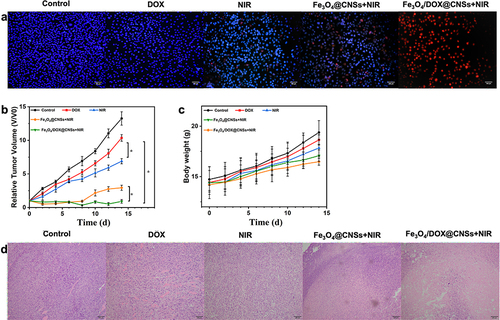
Figure 9 Hoechst 33342/PI fluorescence staining of 4T1 cells after different treatments with NS as control, DOX, NIR, Fe3O4@CNSs + NIR, and Fe3O4/DOX@CNSs + NIR, respectively (a), scale bar = 100 µm. The relative tumor volume (b) and body weights curves (c) of mice after different treatments (*p<0.05). H&E-stained images of tumors from different groups (d), scale bar = 100 µm.