Figures & data
Scheme 1 A schematic illustration of the preparation and application of HTCC in vitro and in vivo.
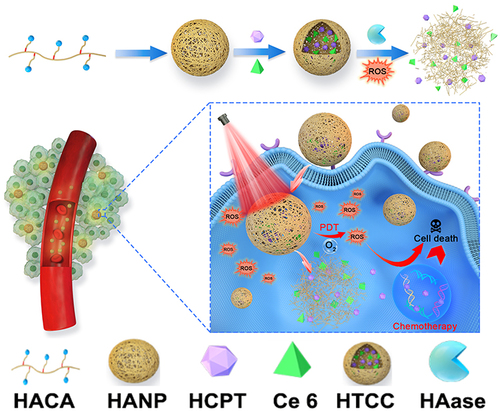
Figure 1 In vitro characterization of HTCC. (A) UV/vis/NIR absorption spectra of HTCC, Ce6, HCPT solution, and HA-tk-CA. (B) Fluorescence spectra of HTCC and free Ce6. (C) Dynamic light scattering analysis for the particle size distribution of HTCC with a diameter of 209 ± 12.33 nm and HA-tk-CA nanoparticle with a diameter of 186 ± 9.58 nm. (D) Zeta potential of HTCC (−40.2 mV), Ce6 (−1.1 mV), HCPT (−4.5 mV), and HA-tk-CA (−31.2 mV) solution by dynamic light scattering. (E) Stability of HTCC in UV/vis/NIR spectra in H2O at room temperature for 0-, 2-, 6-, 12-, 24-, and 48-h incubation. No absorbance changes were noticed. (F) Images of ROS-responsive HTCC under 670-nm laser irradiation. Top left: TEM image of HTCC without NIR laser irradiation. Lower left: TEM image of disrupted HTCC under NIR laser irradiation. Top right: Image of HTCC in water without precipitation. Lower right: Image of HTCC under NIR laser irradiation. HTCC was centrifuged, and a precipitant was noticed. Scale bar = 250 nm.
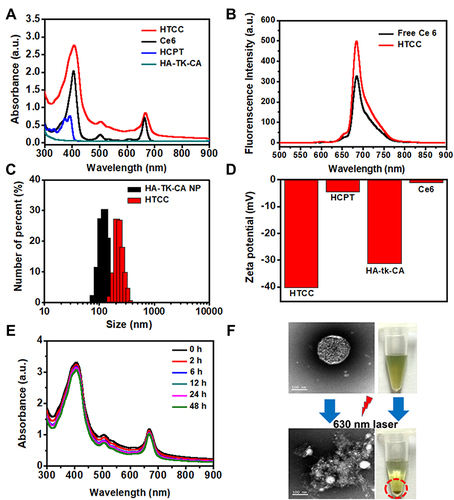
Figure 2 In vitro drug release of HTCC with and without hyaluronidase in an acetate buffer (37°C). 89.20% ± 3.34% of HCPT was released from HTCC in the presence of hyaluronidase and ROS after 24-h incubation at pH 4.2, while only 45.56% ± 11.06% of HCPT was detected when HTCC is incubated with hyaluronidase at pH 7.45. 76.33% ± 3.31% of HCPT was released in 24 h as hyaluronidase was added alone at pH 4.2, while 69.96% ± 2.51% of HCPT was released in the presence of only ROS. Student’s t-test: HTCC with hyaluronidase and laser vs HTCC with hyaluronidase or laser alone, or HTCC with hyaluronidase at pH 7.45, *p <0.05.
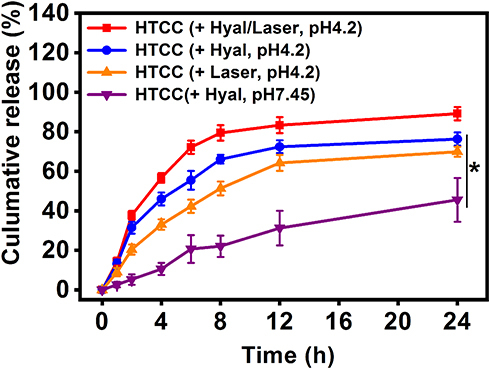
Figure 3 Cell uptake of HTCC in CD44 high-expressing SCC7 and CD44 low-expressing NIH3T cell lines. (A) SCC7 and NIH3T3 cells were incubated with HTCC at an equivalent Ce6 concentration of 40 µg/mL for 6 h and then were imaged by confocal laser scanning microscopy (CLSM) For the blocking group, 10 times the excess amount of free HA was added before HTCC was applied. Strong fluorescent signals from HTCC were observed in SCC7 cells, but few signals could be seen in NIH3T3 cells. When cells were pretreated with HA, no signals were seen in both SCC7 and NIH3T3 cells. As a control, weak signals were detected for Ce6 due to the nonspecific accumulation in both SCC7 and NIH3T3 cells. The red color is from Ce6, while the blue color indicates DAPI. The scale bar is 20 μm. (B) Quantification of (a) Student’s t-test: HTCC on SCC7 cells vs Ce6, HTCC vs Blocked, and HTCC on SCC7 cells vs HTCC on NIH3T3 cells, *p < 0.05.
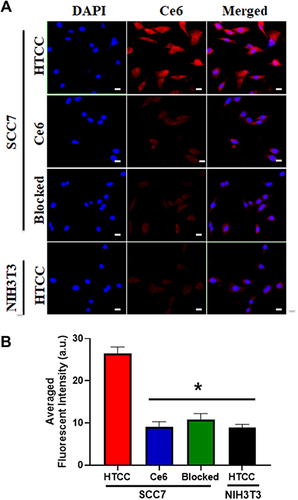
Figure 4 ROS generation and cytotoxicity of HTCC. (A) Verification of ROS generation by a commercialized ROS probe (DCFHDA) Higher fluorescent intensities indicate a greater rate of ROS generation. A strong fluorescent signal was detected from DCF when ROS was generated through HTCC and 670 nm NIR laser illumination in cells. The oxidation of DCFHDA can be diminished by adding a ROS scavenger, NAC. The fluorescent signal intensity was quantified on the right. Student’s t-test: HTCC with DCFDA vs DCFDA, p < 0.05. HTCC with DCFDA vs HTCC with DCFDA and NAC, p < 0.05. (B) Cell viability of the SCC7 cells incubated with HANP, HANP/HCPT, HANP/Ce6, and HTCC without or with 670-nm laser irradiation (100 mW/cm2, 10 min) The equivalent concentrations of the HCPT are 1, 10, 50, 100, and 200 μg/mL. Student’s t-test: *p < 0.05, **p < 0.005, *** p < 0.0005. (C) Calcein AM/PI co-staining by fluorescence microscopy. SCC7 cells were incubated with HANP (with a laser), HANP/HCPT (without laser), HANP/Ce6 (with a laser), and HTCC (with and without laser) Red color stains for dead cells, and green color indicates the live cells. The scale bars represent 100 μm. (D) Quantification of dead cells as stained in (c) Student’s t-test: HTCC vs HTCC without laser, HTCC vs HANP/C with laser, HTCC vs HANP/HCPT without laser *p < 0.05, HTCC vs HANP with laser, **p < 0.005.
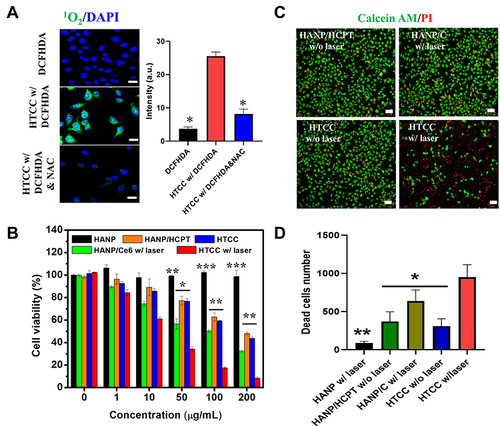
Figure 5 In vivo NIR fluorescence imaging of HTCC in the SCC7 tumor-bearing mouse model. (A) In vivo, NIR fluorescent imaging of SCC7 tumor-bearing mice was taken at different times after intravenous injection of HTCC and free Ce6. Arrows indicate the tumor locations. (B) Tumor/muscle (T/M) ratio of SCC7 tumor-bearing mouse model. HTCC peaked in the tumor at 8 h post-injection. No obvious Ce6 tumor accumulation was seen. (C) Ex vivo fluorescence images of organs and tumors harvested at 8 h after injection of HTCC and free Ce6 in mice. (D) Quantification of normal organ fluorescent imaging in (c) **p < 0.005.
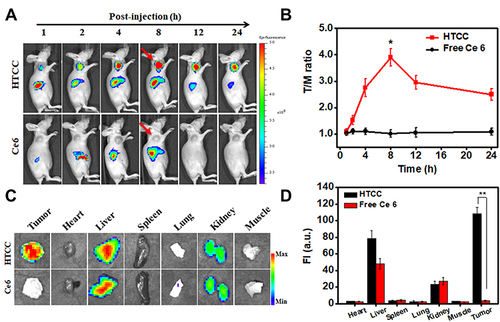
Figure 6 Chemotherapy and photodynamic therapy of SCC7 tumors with HTCC. (A) Typical photographs of SCC7 tumor-bearing mice at different days after HTCC treatment. (B) Tumor growth curves of different groups of SCC7 tumor-bearing mice. Error bars represent the standard deviations of five mice per group. Student’s t-test: HTCC w/IR vs HTCC without IR, HTCC with IR vs HCC with IR, HTCC with IR vs HCC without IR, HTCC with IR vs HANP/HCPT with IR, HTCC with IR vs HANP/HCPT without IR, *p < 0.05, HTCC with IR vs non-treated control, HTCC with IR vs HANP, HTCC with IR vs HANP/Ce6 without IR, HTCC with IR vs HANP/Ce6 with IR, **p < 0.005. (C) H&E-stained tumor sections of SCC7 tumor-bearing mice in different groups at three days after the last treatment. (D) Body weights changes in mice received different treatments during the study.
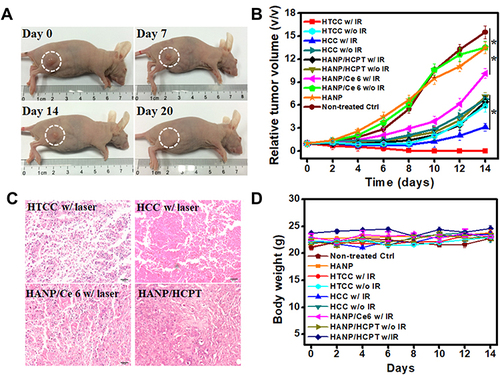
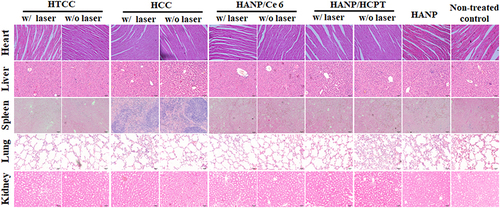
Figure 7 Representative photos of mice after different treatments and histological images of major organs using H&E staining. No noticeable abnormality was found in the heart, liver, spleen, lung, or kidney.