Figures & data
Table 1 Experimental Factors and Level
Figure 1 Characterisation of VAN/PLGA microspheres. (A) The standard release curve of VAN. (B) Macroscopic images of successfully prepared microspheres. (C–F) SEM images of the microspheres under different magnifications (150×, 500×, 1000×, 2000×, respectively). (G) Size distribution of microspheres.
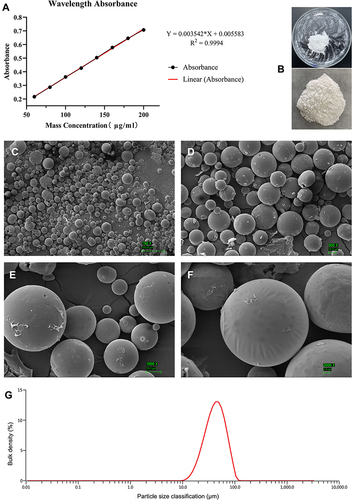
Table 2 Orthogonal Test Table
Figure 2 In vitro release and bacteriostatic activity of VAN/PLGA-MS. (A) Cumulative release curve of VAN/PLGA microspheres in 24 days. The picture on the left shows the cumulative release curve of 0–24 h, and the picture on the right shows the cumulative release curve of 0–24 days. (B) Bacteriostatic experiment of PLGA microspheres in vitro. (C) Bacteriostatic test of VAN/PLGA microspheres in vitro.
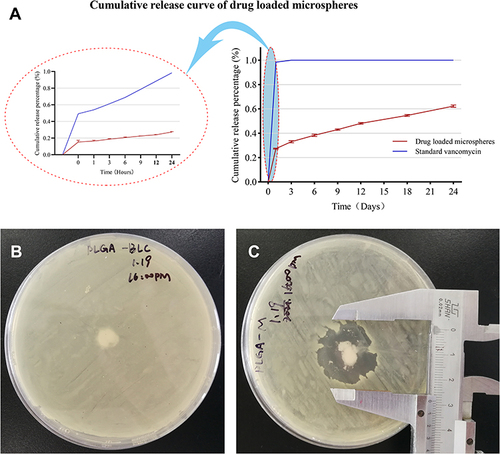
Figure 3 Characterisation of two groups of scaffolds. (A and B) General view and stress–strain curve of n-HA/PLA scaffold. (C and D) General view and stress–strain curve of VAN/MS-PLA/n-HA scaffold. (E–J) SEM images of n-HA/PLA scaffold under various magnifications. (K–P) SEM images of VAN/MS-PLA/n-HA scaffold under various magnification.
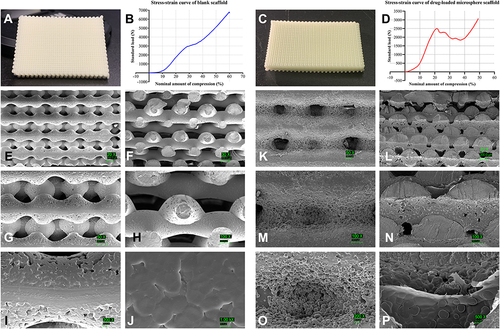
Figure 4 In vitro biological evaluation of the two groups of scaffolds. (A) 14 days after adipogenic induction of ASCs with Oil Red O staining under inverted microscope (100×). (B) 14 days after ASC osteogenic induction, alizarin red staining under inverted microscope (100×). (C)The effect of different scaffold on the proliferation of ASCs. (D) Bacteriostatic test of n-HA/PLA scaffold invitro. (E) Bacteriostatic experiment of VAN/MS-PLA/n-HA scaffold invitro.
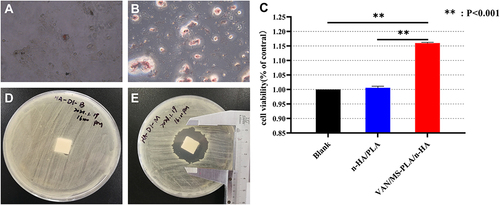
Figure 5 Femur specimens of different scaffold groups observed at 4, 8, and 12 weeks.
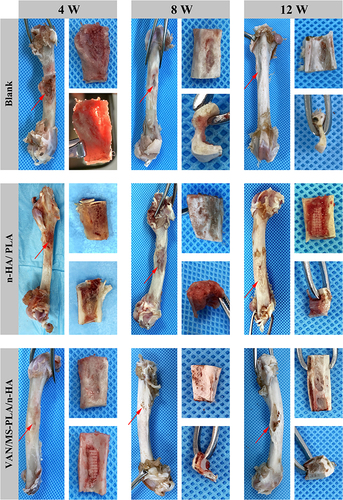
Figure 6 Femur specimens of different scaffold groups observed by X-ray, CT, and three-dimensional reconstruction at 4, 8 and 12 weeks.
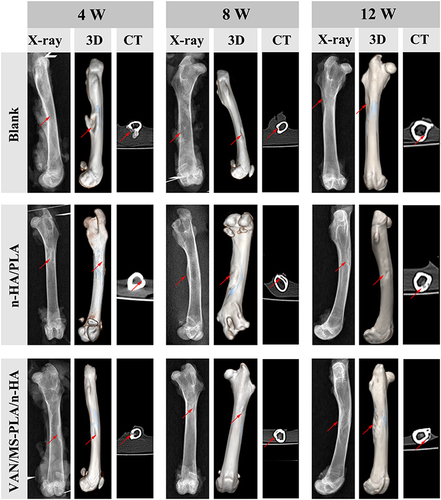
Figure 7 Histopathology of femoral defects in different scaffold groups observed at 4, 8, and 12 weeks.
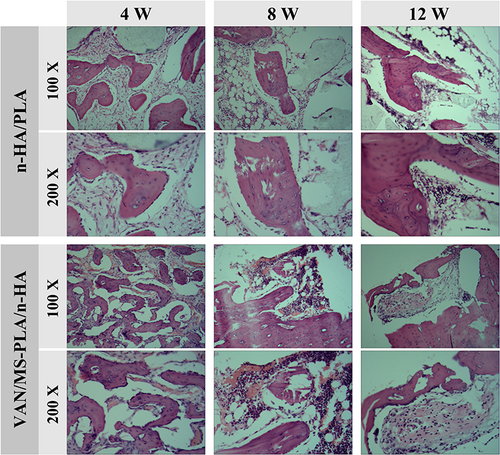
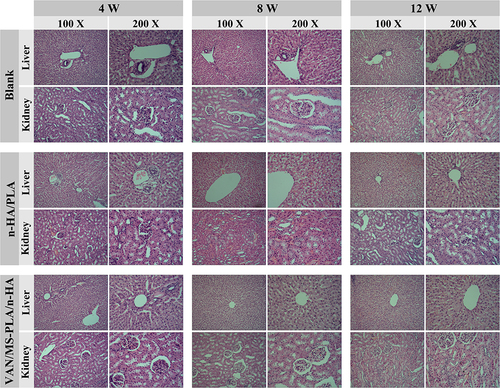
Figure 8 In vivo toxicity of experimental animals in different scaffold groups evaluated at 4, 8, and 12 weeks (liver and kidney tissue).