Figures & data
Figure 1 Characterization of Nano PTL. (A) LC-MS spectrum of Nano PTL. (B) Nuclear magnetic resonance hydrogen spectrum of Nano PTL. (C) Representative image of TEM of Nano PTL (bar, 1 µm). (D) Size distribution of Nano PTL (n=3 independent experiments). (E) Zeta potential of Nano PTL (n=3 independent experiments). (F) Infrared spectroscopy of Nano PTL. (G) Uptake rates of PTL and Nano PTL by intestinal epithelial cells (n=3 independent experiments). (H) Uptake of FITC by intestinal epithelial cells at each time point (n=3 independent experiments, bar, 40 µm).
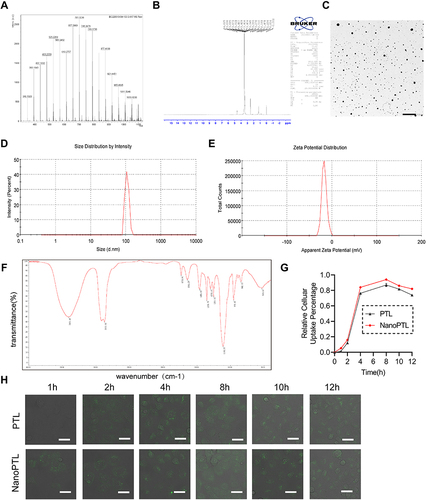
Figure 2 Protective effect of Nano PTL on sepsis rats. (A) Survival rate. (B) Survival time of each group (n=16 per group). Effects of Nano PTL on (C) IL-6, (D) IL-1β and (E) TNF-α level (n=8 per group). Effects of Nano PTL on (F) ALT, (G)AST, (H) Crea and (I) Urea level (n=8 per group). (J) Mean arterial pressure of septic rats (n=8 per group). *P<0.05, compared with the Sham group. #P<0.05, compared with the Sep group. +P<0.05, compared with CT group. @P<0.05, compared with the PTL group.

Figure 3 Protective effect of Nano PTL on intestinal barrier function in septic rats. (A) Representative microphotographs of HE staining in intestine (bar, 100 µm, n=8 per group). (B and C) EB leakage of intestine after treated with Nano PTL (n=8 per group). (D) D-Lactic acid level in septic rats (n=8 per group). (E and F) Relative expression of ZO-1 intestinal tissues of rats (n=3 independent experiments). (G and H) Relative expression of ZO-1 in intestinal epithelial cells (n=3 independent experiments). (I) Representative immunofluorescence image of ZO-1 of intestinal epithelial cell (bar, 20 µm, n=3 independent experiments). (J) Effect of Nano PTL on TEER (n=3 independent experiments). *P<0.05, compared with the Sham group or Normal group. #P<0.05, compared with the Sep group or LPS group. +P<0.05, compared with the CT group. @P<0.05, compared with the PTL group.
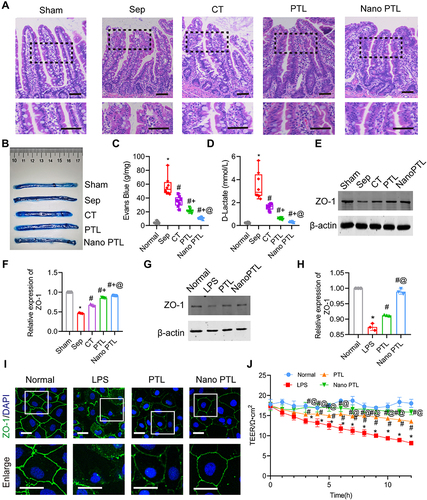
Figure 4 Network pharmacology predicts the action target of PTL. (A) Target gene of PTL obtained from Swiss target prediction. (B) Target gene of PTL on Sepsis. (C) KEGG enrichment pathway. (D) Venn diagram. (E) Western blot of 5-HTR2A and PKC in intestinal epithelial cells after treated with Nano PTL (n=3 independent experiments). (F and G) The relative expressions of 5-HTR2A and PKC (n=3 independent experiments). *P<0.05, compared with Normal. #P<0.05, compared with the LPS group. @P<0.05, compared with the PTL group.
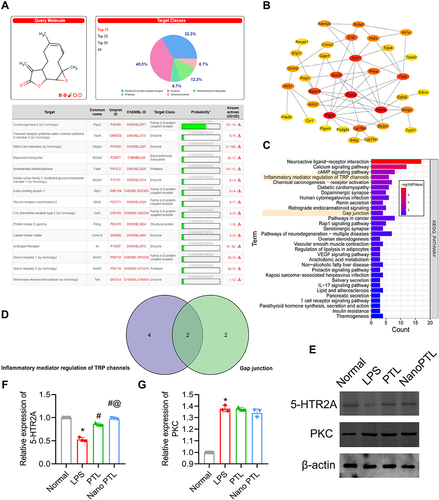
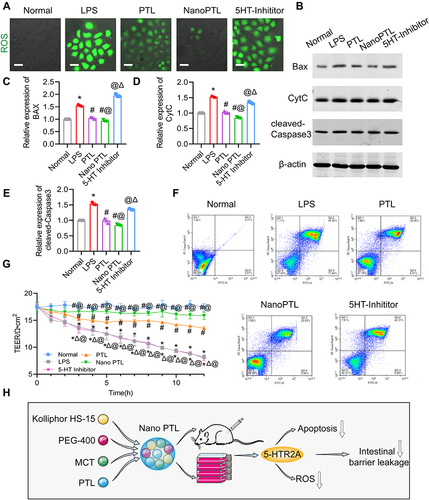
Figure 5 Protective effect of Nano PTL on ROS and apoptosis of intestinal epithelial cells through 5-HTR2A. (A) ROS level of intestinal epithelial cells (bar, 20 µm, n=3 independent experiments). (B) The effect of Nano PTL on the expression of apoptosis-related proteins Bax, CytC and cleaved-Caspase3 (n=3 independent experiments). Analysis of relative expressions of (C) Bax, (D) CytC, and (E) cleaved-Caspase3. (F) Flow cytometry of apoptosis. (G) Effect of 5HT-Inhibitor on TEER (n=3 independent experiments). (H) The schematic diagram for the mechanism of the therapeutic effect of Nano PTL on intestinal barrier function after sepsis. *P<0.05, compared with Normal. #P<0.05, compared with the LPS group. @P<0.05, compared with the PTL group ΔP<0.05, compared with the Nano PTL group.