
Figures & data
Table 1 Primer Sequences of Crucial Genes
Figure 1 Transmission electron microscopy analysis. (A and B): the morphology of MWCNTs. Scale bar: 50 nm (A), 10 nm (B and C): the internalization of MWCNTs (arrow) into human retinal pigment epithelial ARPE-19 cells. Magnification, × 2000. Scale bar: 5 μm; (D), the morphology of human retinal pigment epithelial ARPE-19 cells without exposed to MWCNTs. Magnification, × 2000. Scale bar: 5 μm.
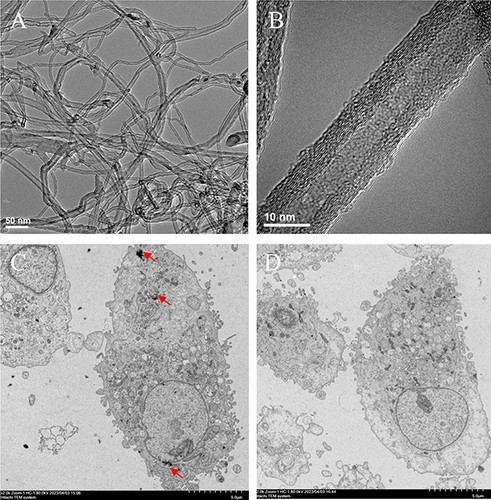
Figure 2 MWCNT-induced toxicities on human retinal pigment epithelial ARPE-19 cells. (A), cell viability analysis after 24 hours of exposure to different concentrations of MWCNTs (0–200 µg/mL); (B), determination of IC50 values; (C), cell apoptosis analysis after 24 hours of exposure to concentrations corresponding to 0 μg/mL (left, C-1) and IC50 (100 µg/mL; right, N-100-1) of MWCNTs; (D), bar graphs to show the percentages of apoptotic and necrotic cells.
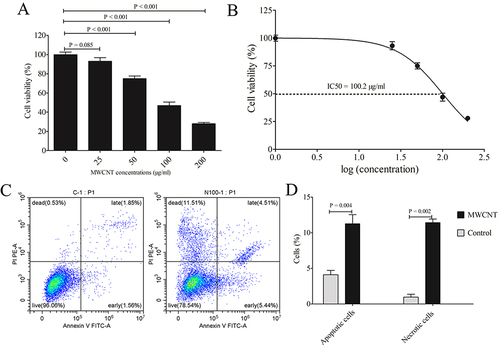
Figure 3 Identification of differentially expressed genes. (A), volcano plot of differentially expressed genes between MWCNT-treated and control cells (red, upregulated; blue, downregulated; black, non-significant); (B), heat map analysis of differentially expressed genes between MWCNT-treated and control cells (red, upregulated; blue, downregulated).
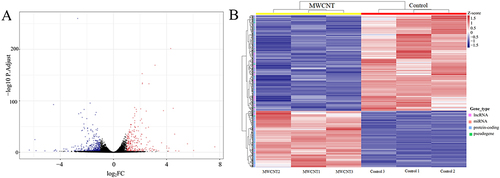
Table 2 Modules Identified by WGCNA
Figure 4 Determination of the optimal soft-thresholding power in WGCNA. (A), analysis of the scale-free fit index for various soft-thresholding powers (β); (B), analysis of the mean connectivity for various soft-thresholding powers; (C), histogram of the connection distribution when β was 24; (D), checking the scale-free topology when β was 24. Scale R2 = 0.89, slope = −0.77.
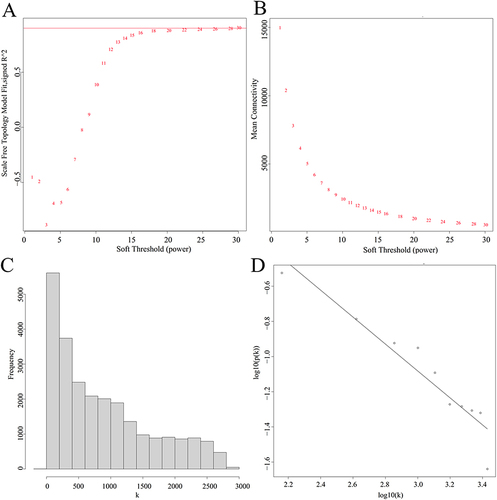
Figure 5 Identification of crucial co-expressed modules associated with MWCNT-induced toxicity in ARPE-19 cells. (A), the clustering dendrogram. Different colors were assigned to corresponding modules. Branches above indicate genes and different colors below represent specific co-expression modules; (B), Module-trait correlations. Each row corresponds to a module eigengene (ME) and each column corresponds to a phenotype. Each cell includes the correlation coefficient and p-value (in bracket). Red box indicates modules significantly associated with MWCNT treatment; (C), correlation between module membership of brown 1 module and gene significance with clinical traits (cor = 0.61, p < 1E-200); (D), correlation between module membership of darkorange2 module and gene significance with clinical traits (cor = 0.71, p < 6.7E-150).
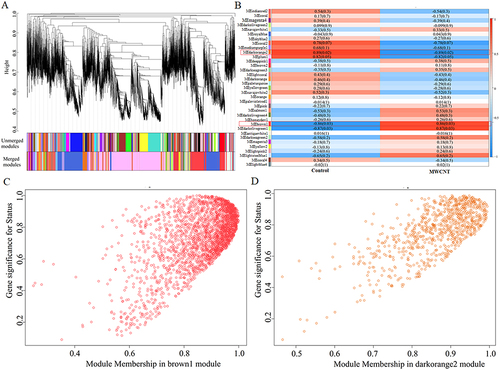
Table 3 Topological Characteristics for Genes in the Protein–Protein Interaction Network
Figure 6 Modules extracted from the protein–protein interaction network. (A), module 1; (B), module 2. Red indicates upregulated genes; blue indicates downregulated genes.
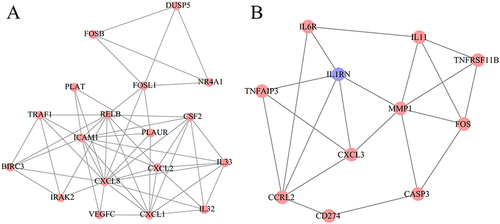
Figure 7 Function enrichment results for hub mRNAs. (A), GO biological processes terms; (B), KEGG pathways.
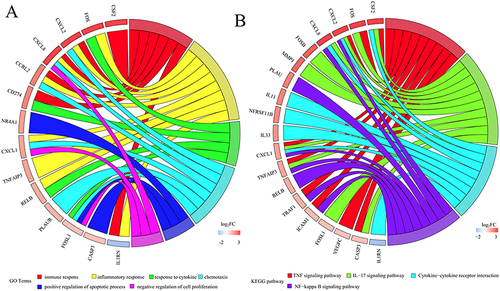
Figure 8 Co-expression networks between lncRNAs and mRNAs. (A), relationship pairs for upregulated lncRNAs and mRNAs (red); (B), relationship pairs for downregulated lncRNAs and mRNAs (blue). Ellipse indicates the mRNAs; hexagon indicates the lncRNAs.
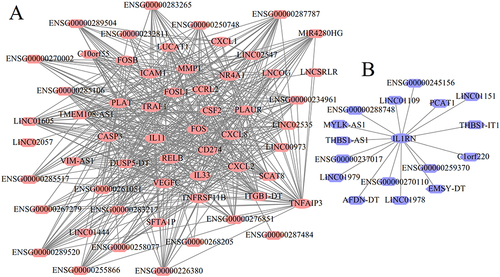
Figure 9 Validation of hub genes induced by MWCNTs in ARPE-19 cells. (A), the expression levels of hub genes measured by RNA-seq; (B), the relative expression levels of hub genes determined by qRT-PCR; (C), the release of CXCL8, MMP1, CXCL2 and IL11 determined by ELISA; (D), the caspase-3 enzymatic activity determined by the caspase-3 colorimetric assay kit; (E), Western blotting band for FOS protein; (F), quantitative expression levels of FOS protein. All results presented are representative of mean ± standard deviations of at least 3 independent experiments. P-value < 0.05 indicates statistical significance.
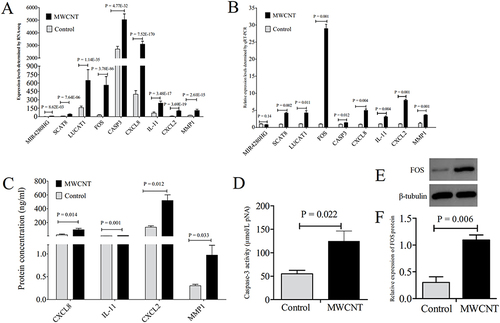
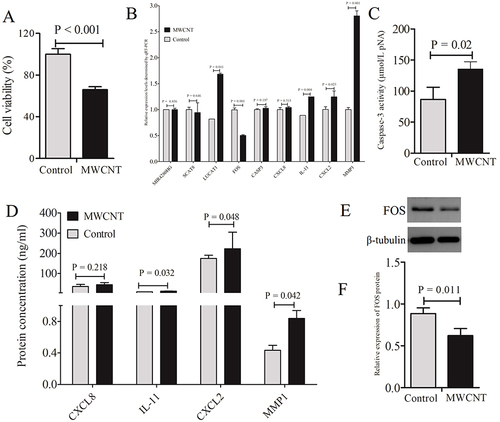
Figure 10 Validation of the toxicity and mechanisms of MWCNTs in HCE-T cells. (A), CCK-8 assay detected cell viabilities of HCE-T incubated with MWCNTs for 24 hours; (B), qRT-PCR analysis measured the relative expression levels of hub genes identified in ARPE-19 cells; (C), ELISA observed the production of CXCL8, MMP1, CXCL2 and IL11; (D), colorimetric analysis determined the caspase-3 enzymatic activity; (E), Western blotting band for FOS protein; (F), quantitative expression levels of FOS protein. All results presented are representative of mean ± standard deviations of three independent experiments. P-value < 0.05 indicates statistical significance.
Data Sharing Statement
Data analyzed are available from the corresponding authors on request.