Figures & data
Figure 1 Chemical structure of pravastatin sodium.
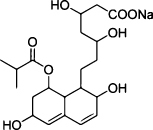
Table 1 Formulation Code for Preparation of Various Polymeric Nanoparticles Compositions
Table 2 Levels of Independent Variables and Their Levels Applied Using the Experimental Design
Table 3 Independent & Dependent Variables
Table 4 Coded Independent Variables and Properties of PVS -PLGA-NPs
Table 5 ANOVA Results for Responses Provided by Design Expert
Figure 2 Particle size distribution graph (A) and zeta potential distribution graph (B).
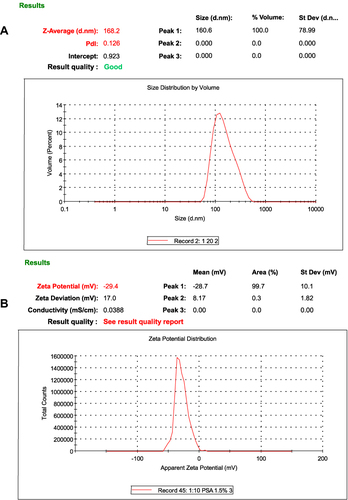
Figure 3 Continued.
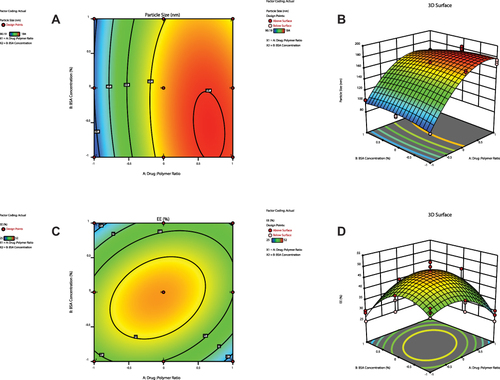
Figure 3 Contour plots (A, C and E) and three-dimensional surface plots (B, D and F) representing the effect of interaction between drug:polymer ratio (A) and surfactant concentration (B) on particle size, entrapment efficiency percent and zeta potential, respectively.
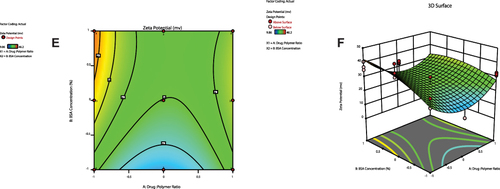
Table 6 Adjusted Levels of Independent Variables, Predicted and Observed Responses for Optimized Formula
Figure 4 Transmission electron microscope (TEM) of F5 NPs.
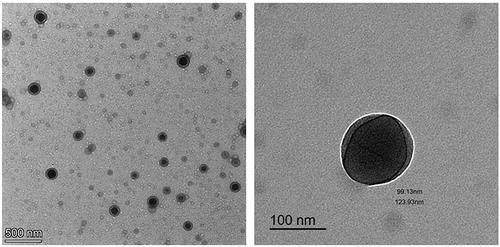
Figure 5 Scanning electron microscope (SEM) of F5 NPs.
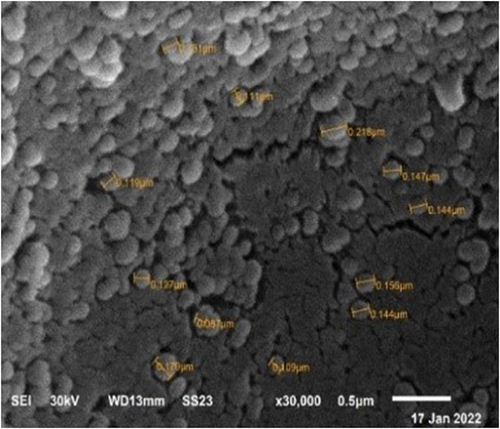
Figure 6 Solid characterizations of the optimized formula (F5), FTIR spectra (A), DSC thermograms (B) and PXRD patterns (C) of (I) PVS, (II) PLGA, (III) BSA, (IV) physical mixture, (V) optimized F5 and (VI) plain F5.
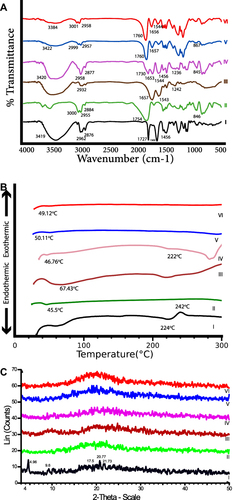
Figure 7 In vitro release profile of free PVS and the optimized formula F5 in 0.1 N HCL pH 1.2 (A), phosphate buffer pH 6.8 (B) and phosphate buffer pH 7.4 (C).
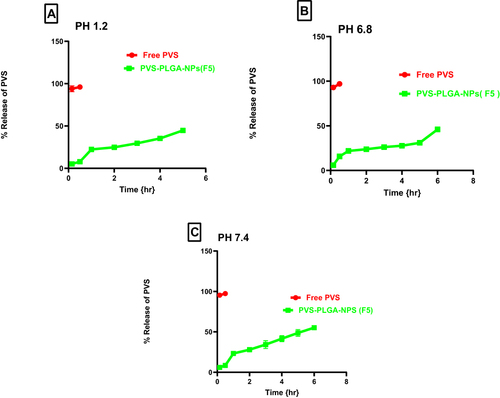
Table 7 Kinetic Analysis of Drug Release Data
Table 8 PS, PDI, ZP, EE% of PVS–PLGA-NPs Aqueous Dispersion (F5) Stored at Refrigerated (4 ± 2°C) and at Ambient Condition (25 ± 2°C)
Table 9 Effect of Optimized Formula (F5) and PVS Solution on Serum Lipid Profile
Figure 8 The serum level of the examined lipid biomarker after the end of treatment period (1 week) with F5 NPs and PVS solution.
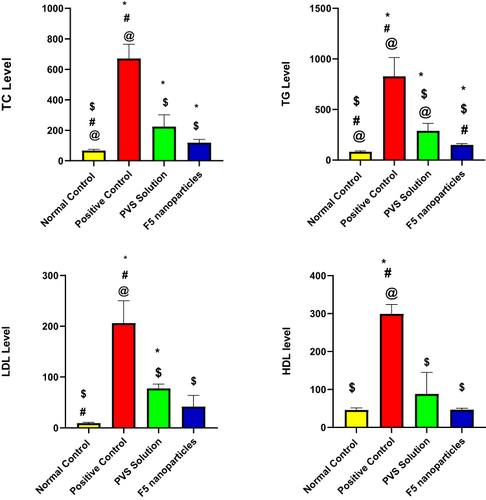
Table 10 Effect of F5 NPs and PVS Solution on Serum Liver Function Test, Albumin and Alkaline Phosphatase
Figure 9 Effect of F5 NPs and PVS solution on serum liver function.
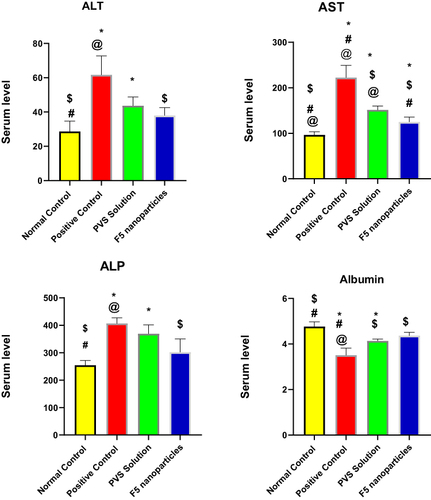
Figure 10 Microscopic pictures of H&E-stained hepatic sections showing normal organization of hepatic cords H around central veins (CV) with normal portal areas (PA) and sinusoids (S) in the negative control group (A1 and A2). Hepatic sections from positive control group (B1 and B2) showing congested central veins (CV, red arrow), fat vacuoles (black arrows) in hepatocytes (H), dilated sinusoids (S), mononuclear cells infiltration in portal areas (PA, yellow arrows), bile duct dilation (arrowheads). Hepatic sections from PVS-treated group (C1 and C2) showing fewer fat vacuoles in hepatocytes (black arrows), dilated sinusoids (S), fewer mononuclear cells infiltration in portal areas (PA, yellow arrow), mild bile duct dilation (arrowheads). Hepatic sections from F5 NPs-treated group (D1 and D2) showing restored normal organization of hepatic cords (H) around central veins (CV) with normal portal areas (PA) and sinusoids (S). Low magnification ×: 100 bar 100 and high magnification ×: 400 bar 50.
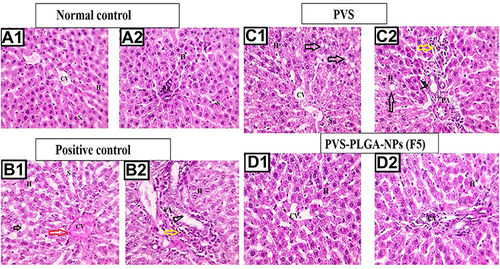
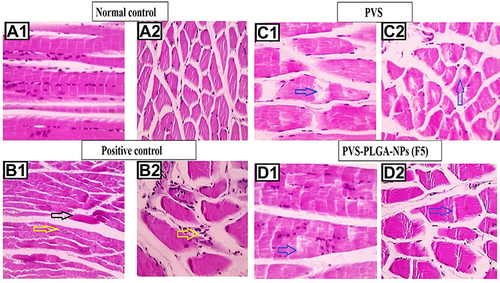
Figure 11 Microscopic pictures of H&E stained longitudinally sectioned skeletal muscles showing normal organization of striated muscle fibers with peripherally located nuclei in negative control group (A1). The longitudinally sectioned skeletal muscles from the positive control group (B1) showing hyaline degeneration (black arrow) in some sections, marked lipid infiltration in muscle fiber and marked mononuclear cells infiltration in interstitial tissue (yellow arrow). The longitudinally sectioned skeletal muscles in the free PVS-treated group (C1), showing moderate lipid infiltration in muscle fibers (blue arrow) and in the F5 nanoparticles-treated group (D1), showing lower lipid infiltration in muscle fibers (blue arrow). The crossly sectioned skeletal muscles showing normal muscle fibers with peripherally located nuclei in negative control group (A2). The crossly sectioned skeletal muscles from positive control group (B2) showing marked lipid infiltration, mild mononuclear cells infiltration (yellow arrows) in muscle fibers and hyaline degeneration in some sections with mild mononuclear cells infiltration. The cross-sectioned skeletal muscles from the free PVS-treated group (C2) showing moderate lipid infiltration in muscle fibers (blue arrow) and in the F5 NPs-treated group (D2) showing very mild lipid infiltration in muscle fibers (blue arrow).