Figures & data
Figure 1 FTIR patterns of (A) ICG, (B) ACC, (C) ICG@, (D) PSC, (E) PSC/ICG@ and (F) PSC/ICG@+DOX nanoparticles.
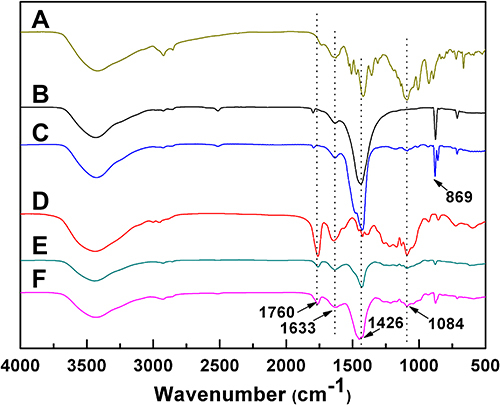
Table 1 Physicochemical Properties of Drug-Free and Drug-Loaded Nanoparticles
Figure 2 TEM images of (A) ACC, (B) ICG@, (C) PSC/ICG@ and (D) PSC/ICG@+DOX nanoparticles.
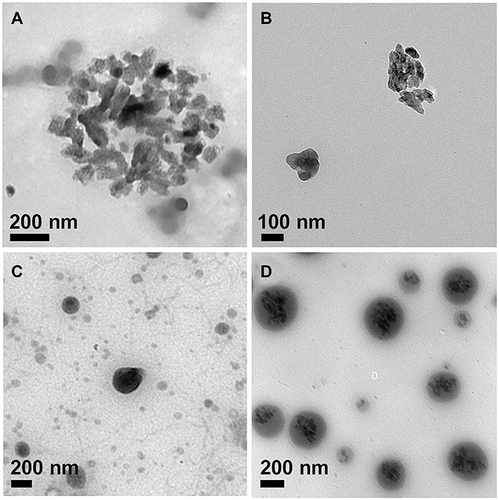
Figure 3 (A) Temperature changes of different formulations with the same ICG concentration (10 μg/mL) under NIR irradiation for 5 min. The temperature was determined by a thermocouple. (B) Infrared thermal images of water, ICG, PSC/ICG@ and PSC/ICG@+DOX nanoparticles under NIR irradiation for 5 min. (C) changes in absorption values of free ICG, PSC/ICG@ and PSC/ICG@+DOX nanoparticles in distilled water at 784 nm (n = 3).
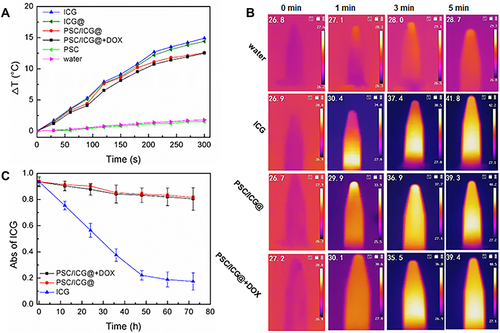
Figure 4 DOX release profiles of PSC/ICG@+DOX nanoparticles in PBS (pH 7.4, or pH 5.5) in the presence or absence of 20 mM GSH at 37°C.
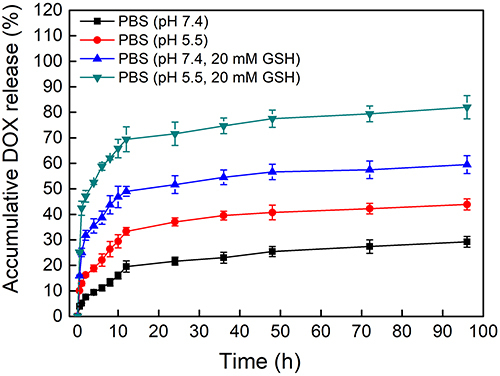
Figure 5 CLSM images of 4T1 cells treated with (A) DOX·HCl, (B) DOX·HCl+ICG (NIR), (C) PSC/ICG@+DOX nanoparticles (no NIR), and (D) PSC/ICG@+DOX nanoparticles (NIR).
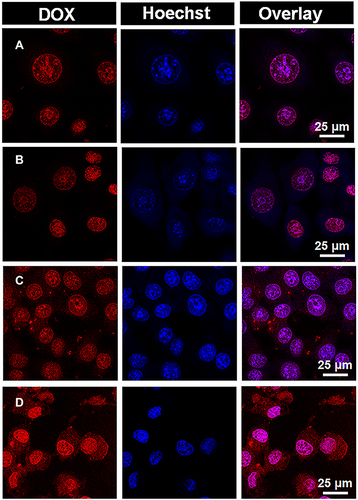
Figure 6 In vitro cytotoxicity in 4T1 cells treated with DOX·HCl, ICG, DOX·HCl+ICG, PSC/ICG@ nanoparticles, PSC/ICG@+DOX nanoparticles in the absence (A) or presence (B) of 808 nm NIR irradiation. (n=4).
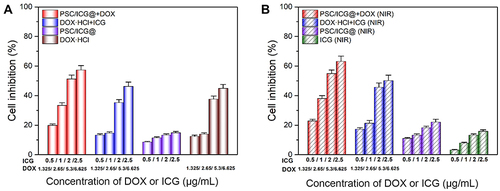
Figure 7 (A) Scheme of the timeline for in vivo treatment and laser irradiation in 4T1-bearing orthotopic mice. (B) Tumor growth curves of mice after the treatment. (C) The images of 4T1-bearing mice with the injection of 5% glucose, DOX·HCl+ICG, PSC/ICG@ or PSC/ICG@+DOX nanoparticle after laser irradiation under the 808 nm laser irradiation (2.0 W/cm2) at 24 h post-injection. (D) Body weight change within 14 days. *P < 0.05, PSC/ICG@+DOX (NIR) group vs PSC/ICG@+DOX (no NIR) group; **P < 0.01 PSC/ICG@+DOX (NIR) group vs other groups; #P < 0.05, PSC/ICG@+DOX group (no NIR) vs DOX·HCl group. (n=5).
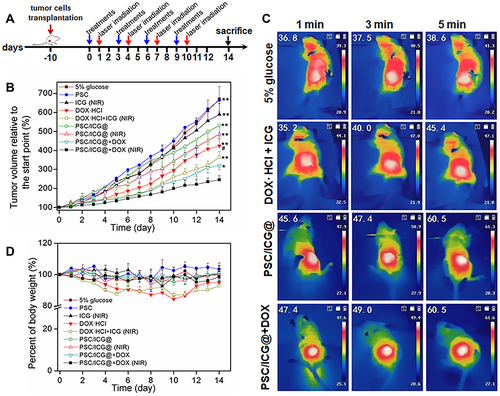
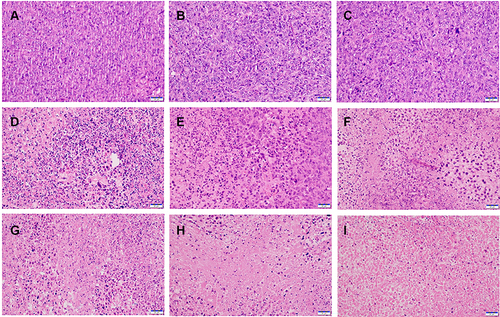
Figure 8 H&E staining images of the tumors with the treatments of (A) 5% glucose, (B) PSC, (C) ICG (NIR), (D) PSC/ICG@, (E) PSC/ICG@ (NIR), (F) DOX·HCl, (G) DOX·HCl+ICG (NIR), (H) PSC/ICG@+DOX, and (I) PSC/ICG@+DOX (NIR), respectively. Scale bar, 20 μm.