Figures & data
Figure 1 Preparation and characterization of MTX-TK-HA/PLA-mPEG nanoassemblies. Synthesis scheme for (A) ROS-responsive HA-conjugated methotrexate prodrug (MTX-TK-HA) and (B) PLA-mPEG, respectively. (C) Particle size and (D) zeta-potential distribution of MTX-TK-HA/PLA-mPEG nanoassemblies.
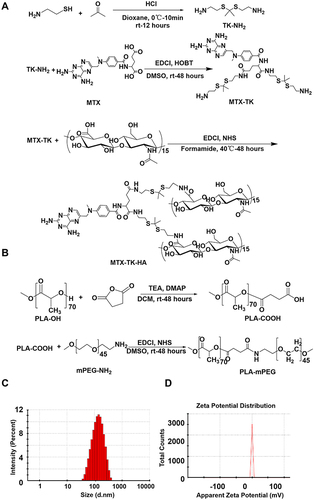
Figure 2 (A) TEM image of MTX-TK-HA/PLA-mPEG nanoassemblies. Scale bar 200 nm. (B) Critical micelle concentration of MTX-TK-HA/PLA-mPEG nanoassemblies. (C-E) Stability of nanoassemblies in PBS buffers with pH of 7.4, 6.0, 5.0, respectively. (F) Size distributions of MTX-TK-HA/PLA-mPEG nanoassemblies in different concentrations.
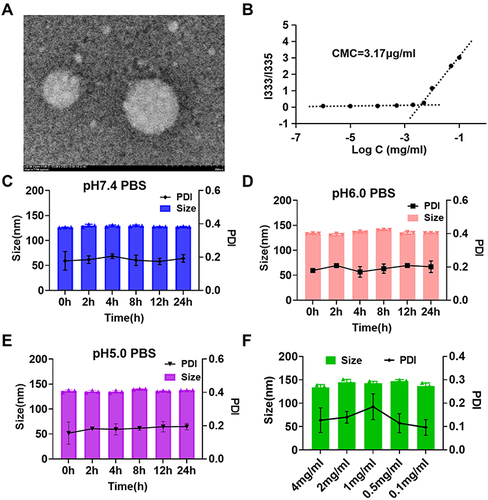
Figure 3 (A) CLSM images of HaCaT cells incubated with FITC-nanoassemblies for 1h, 4 h and 6h, respectively. Nucleus was stained with DAPI (blue). Scale bars are 30μm. (B and C) Hemolysis assay of MTX-TK-HA/PLA-mPEG nanoassemblies. PEI was used as the positive control. (D-F) Western blot analysis of NF-κB and IL-6 expression in IMQ induced HaCaT cells. Results are presented as the mean ± SD (n=3). *P<0.05, **P<0.01 and ***P<0.001, One-Way ANOVA test.
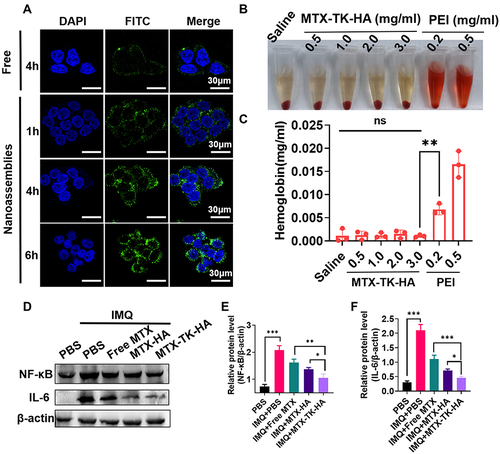
Figure 4 (A and B) Cell viability of HaCaT cells with the treatment of MTX, MTX-TK and MTX-TK-HA at different doses. (C and D) Cell cycle study of MTX-TK-HA/PLA-mPEG nanoassemblies compared with free MTX solution. Results are presented as the mean ± SD (n=3). **P<0.01, One-Way ANOVA test.
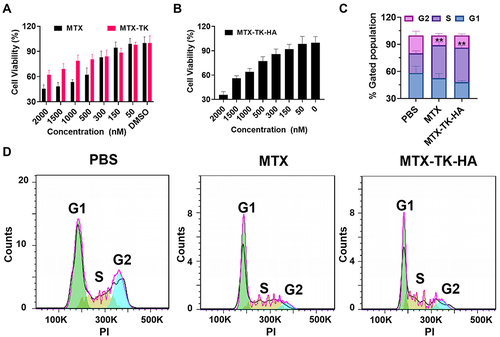
Figure 5 Fabrication and characterization of dissolvable microneedles. (A) Illustration of the fabrication process of Nano-MNs using a micromolding technique. (B) Representative photographs of Nano-MNs containing trypan blue or nanoassemblies. (C) Mechanical strength test for Nano-MNs. (D) Photographs of 1% agarose gel and mouse skin after the insertion of trypan blue loaded MNs. (E) Fluorescence microscopy imaging of a microneedle patch with FITC/Cy5.5-nanoassemblies. (F) In vitro cumulative MTX release from MTX-MNs prepared with HA-10kDa and HA-100kDa at ratios of 1/3, 1/1 and 3/1 in porcine skin, respectively. (G) In vitro cumulative release of MTX from Nano-MNs using a Franz diffusion cell approach. (H) In vitro ROS responsive release of MTX from the FITC-nanoassemblies. Results are presented as the mean ± SD (n=3).
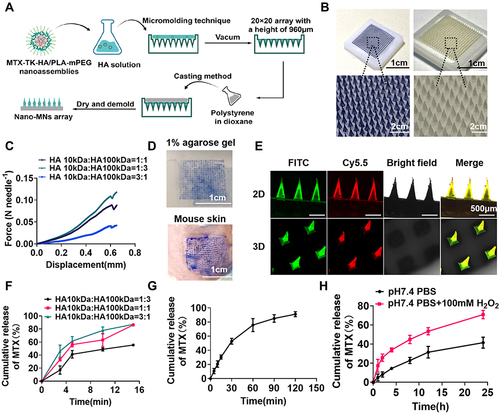
Figure 6 (A) In vivo imaging of Cy5.5-nanoassemblies in IMQ-induced psoriasis-like mice after the application of Cy5.5-nanoassemblies loaded microneedles at 0h, 4h and 24h, respectively. (B) Ex vivo images of the skin and main organs at 1h, 5h and 24h, respectively.
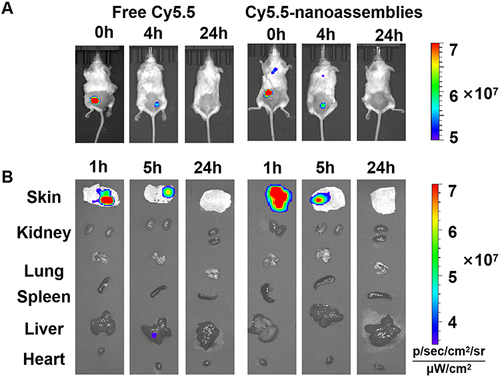
Figure 7 Microneedle arrays loaded with nanoassemblies alleviate the psoriasis-like dermatitis. (A) Schematic illustration of Nano-MNs for the psoriasis treatment. (B) The alternation of the body weight during treatments. (C and D) Spleen weight and spleen/body weight ratio of mice at day 7. (E) Representative photographs of the isolated spleen at day 7. (F-H) Immunoblot analysis of NF-κB and IL-6 expression levels in the inflamed skin homogenates. (I) ELISA analysis of cAMP level in the psoriatic skin. *P<0.05, **P<0.01 and ***P<0.001, One-Way ANOVA test.
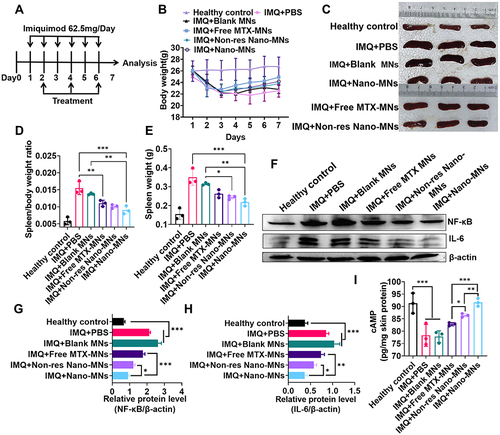
Figure 8 Skin morphology and PASI score in psoriatic mouse model after Nano-MNs treatment. (A) The appearance and morphology of skin from day 1 to day 6. Healthy mice were used as the control. (B-F) Induration, desquamation, erythema and total PASI scores of the back skin. (G) Analysis of the thickness of the epidermal layer of mouse back skin in H&E staining sections. *P<0.05 and ***P<0.001, One-Way ANOVA test.
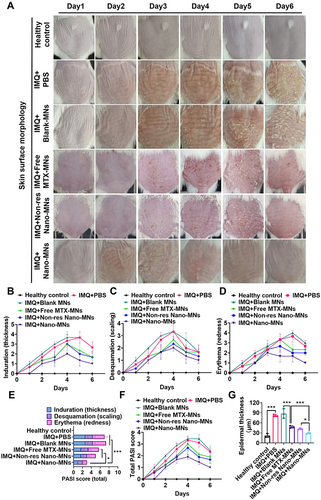
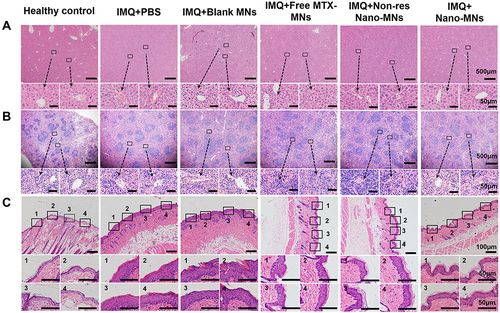
Figure 9 Representative H&E staining of liver (A), spleen (B) and skin sections (C) at day 7. The inset indicates the enlarged views.
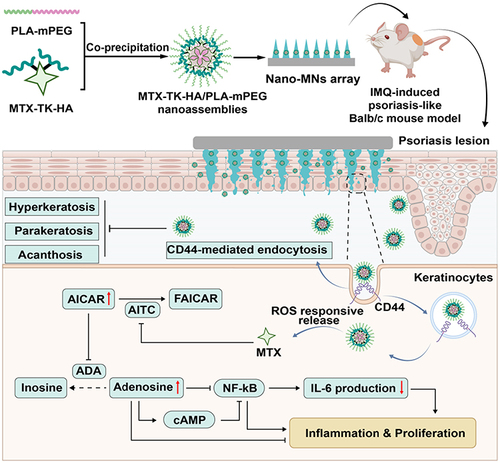
Scheme 1 Illustration of topical delivery of MTX by Nano-MNs array for anti-inflammatory effect in psoriasis treatment. MTX-TK-HA/PLA-mPEG nanoassemblies were prepared by facile co-precipitation, and then loaded in the dissolvable microneedles utilizing a micromolding technique for painless transdermal administration. After applying Nano-MNs to the psoriasis lesion, the nanoassemblies was rapidly released and accumulated in keratinocytes via CD44-mediated endocytosis, followed by ROS-responsive release of MTX to exert anti-inflammation and anti-proliferation effect.