
Figures & data
Figure 1 Characterization of the Exo and ANG-Exo-RIF. TEM image of free Exos (A-1) and ANG-Exo-RIF (A-2). Characteristic membrane protein of Exos (B-1) and ANG-Exo-RIF (B-2) analyzed by Western blot. Size distribution of Exos (C-1) and ANG-Exo-RIF (C-2) examined by NTA. (D) ANG-Exo-RIF observed by Exoview. The green fluorescence represents ANG (labeled with FITC), and the red fluorescence represents Exos (labeled with anti-CD81-Alexa 555). Merged fluorescence is shown in yellow indicated colocalization. (E). UV-Vis absorption spectrum of Exo (blue line) and Exo-RIF (red line), Exo-RIF has absorption peak at 473nm (red arrow). (F). The zeta potential of Exo, Exo-RIF and ANG-Exo-RIF.
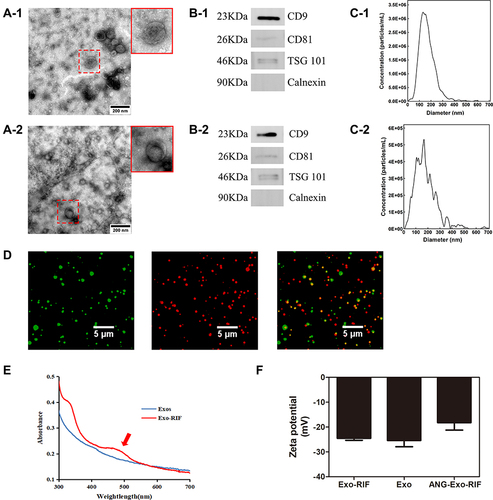
Figure 2 Biosafety of ANG-Exo-RIF in vitro and in vivo. (A). Bend.3 cells were treated with RIF, Exo-RIF and ANG-Exo-RIF for 24h, then the cell viability was detected by CCK8 assays. (B). HE staining analysis of main organs in mice 30 days after intravenous injection of different agents.
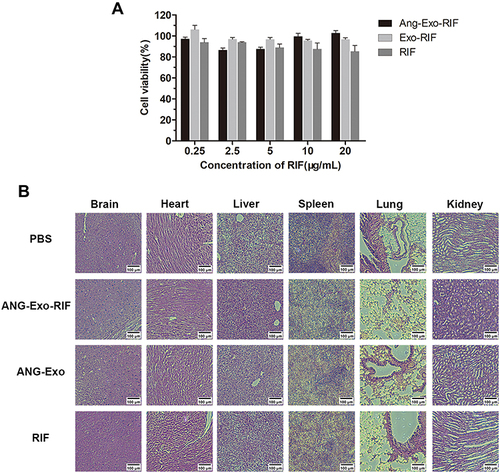
Figure 3 The targeting capability of ANG-Exo-RIF in vitro. (A). Bend.3 cells and astrocyte cells were treated with ANG-Exo-RIF and Exo-RIF. Blue: nucleus stained by DAPI. Red: exosomes dyed by DiI. (B). Mean fluorescence intensities of different groups according to flow cytometric results, each bar represents the mean ± SD of three replicates. **Means p < 0.01, ***Means p < 0.001.
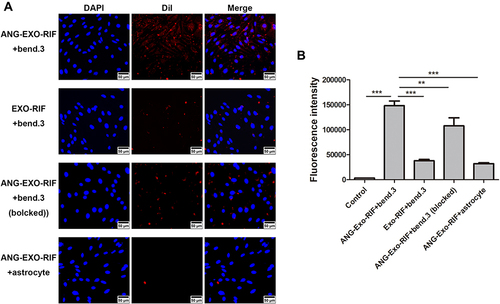
Figure 4 The ability of ANG-EXO-RIF cross the BBB in vitro. (A) Illustration of Exos crossing the BBB model established by monolayers of Bend.3 cells. (B). The in vitro BBB model transport ratio (%) of ANG-Exo-RIF and Exo-RIF following 24h incubation. Each bar represents the mean ± SD of three replicates. **Means p < 0.01, ***Means p < 0.001.
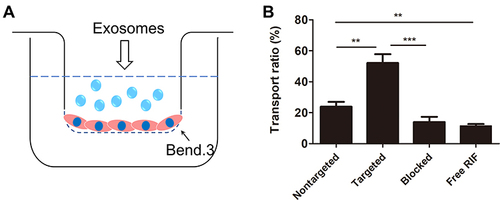
Figure 5 The targeting capability of ANG-Exo-RIF in vivo. (A) In vivo fluorescence images of ANG-Exo-RIF and Exo-RIF in mice (fluorescence represents DiI-labeled exosomes). (B). Ex vivo fluorescence images of isolated brains at 24h after intravenous administration of DiI-labeled exosomes. (C). Comparison of the radiant efficiencies of DiI-labeled exosome in brain region between ANG-Exo-RIF and Exo-RIF groups at the different time points. (D). Frozen section of brain tissue in targeted group and non-targeted group. Red: exosomes labeled with DiI (white arrow). Blue: nuclei stained with DAPI. (E). In vivo fluorescence images of mice in different groups (fluorescence represents Cy7-RIF). (F). Ex vivo fluorescence images of isolated brain at 1h, 12h, 24h after administration (fluorescence represents Cy7-RIF). (G). The radiant efficiencies of Cy7-RIF in brain region of different groups at different time points. Each bar represents the mean ± SD of three replicates. *Means P < 0.05, **Means P < 0.01, and ***Means P < 0.001.
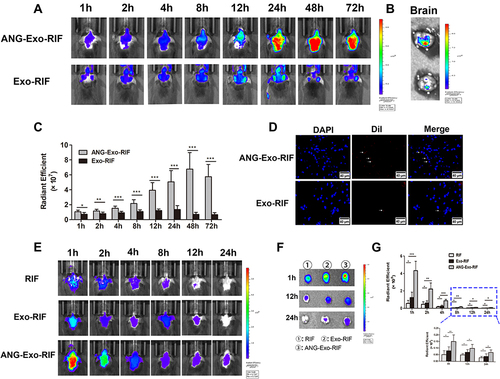
Table 1 MIC and MBC of Rifampicin-Loaded Exosomes Against H37Rv