Figures & data
Figure 1 Characterization of FA-Res liposomes. (A) Photographs of Res liposomes and FA-Res liposomes. (B and C) The TEM images of Res liposomes and FA-Res liposomes. (D and E) Particle size distribution of Res liposomes and FA-Res liposomes. (F and G) Zeta potential of Res liposomes and FA-Res liposomes.
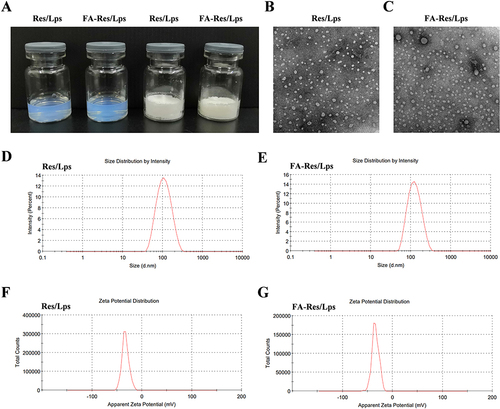
Figure 2 Proliferation and apoptosis of FA-Res liposome-treated osteosarcoma cells and their associated signaling pathways. (A) Cellular uptake of free COU-6, COU-6 liposomes, and FA-COU-6 liposomes by 143B cells. (B) Cell viability of 143B cells after 48 h treatment with free Res, Res liposomes, and FA-Res liposomes. (C and D) The clonogenic capacity of 143B cells and their colony number were calculated. (E and F) Apoptosis analysis of 143B cells by double staining with FITC Annexin V/PI and the percentage of apoptosis was calculated. (G) Expression of Bax, Bcl-2, Caspase-3, Cleaved Caspase-3, and cytochrome C proteins in 143B cells was detected by western blot analysis. All data are expressed as mean ± SD (n=3). *p<0.05, **p<0.01 and ***p<0.001.
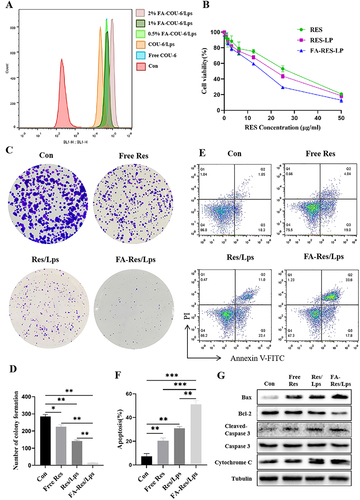
Figure 3 Cell migration and associated signalling pathways in FA-Res liposome-treated osteosarcoma cells. (A and B) Representative images and quantitative data of transwell analysis of 143B cells after 24 hours of treatment with control, free Res, Res liposomes, and FA-Res liposomes, respectively. (C and D) Wound healing of 143B cells after 0 h and 24 h of treatment with control, free Res, Res liposomes, and FA-Res liposomes, respectively, was photographed and their relative healing rates were calculated. (E) Expression of N-Cadherin and vimentin protein in 143B cells were analyzed by Western blot. (F) Expression of P-JAK 2, JAK 2, P-STAT 3, and STAT 3 proteins in 143B cells were analyzed by western blot. All data are expressed as mean ± SD (n=3). *p<0.05, **p<0.01, ***p<0.001, ****p<0.0001.
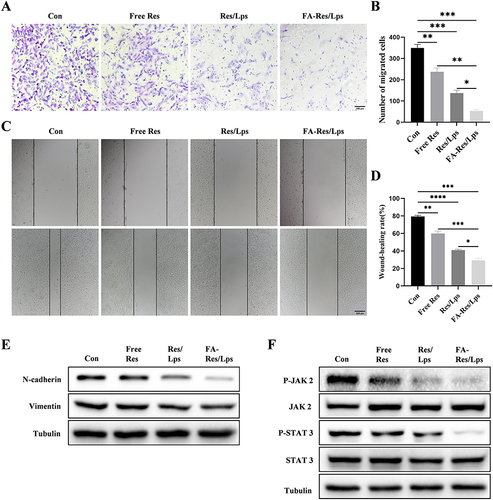
Figure 4 Biodistribution of FA-DiR liposome treatment in 143B xenograft mice. (A and B) Representative in vivo fluorescence images and quantification of fluorescence intensity of DiR-loaded liposomes in 143B cell-induced xenograft mice. (C and D) Representative fluorescence images and quantification of fluorescence intensity of organs and tumors in mice 24 hours after DiR injection. (E) Representative HE-stained images of liver, spleen, and kidney tissues from each group of transplanted tumor model mice. All data are expressed as mean ± standard deviation (n=3). *p<0.05, **p<0.01.
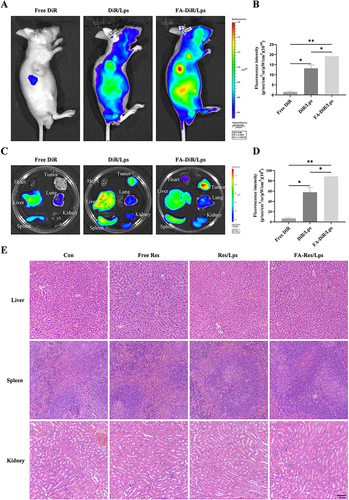
Figure 5 Antitumor effect of FA-Res liposomes treatment in 143B xenograft mice. (A) Representative in vivo animal photographs of 143B-induced xenograft tumor-bearing mice. (B) Curves of changes in subcutaneous tumor volume in each group. (C) Photographs of each group of subcutaneous tumors. (D) Weight of each group of subcutaneous tumors. (E) Body weights of transplanted tumor-bearing mice treated with control, free Res, Res liposomes, and FA-Res liposomes, respectively. (F) Representative HE staining images and Ki67 immunohistochemistry images of each group of tumors. (G) Quantitative Ki67 immunohistochemistry data for each group of tumors. (H and I) Representative TUNEL staining images and quantitative TUNEL staining data for each group of tumors. All data are expressed as mean ± standard deviation (n=3). *p<0.05, **p<0.01, ***p<0.001, ****p<0.0001.
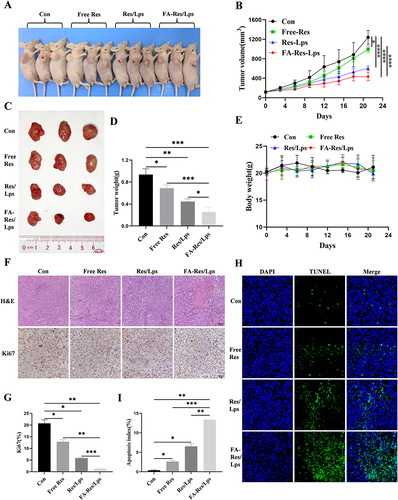
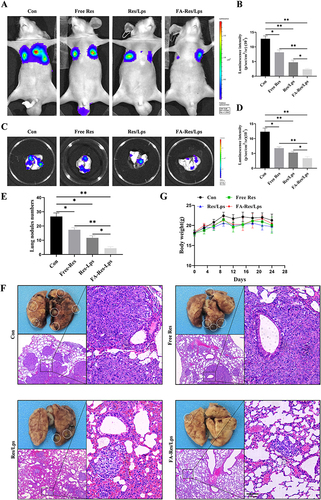
Figure 6 FA-Res liposomes inhibited the lung metastases of osteosarcoma in vivo. (A–D) Fluorescence imaging of luciferase and quantitative data in OS lung metastases mouse model in vivo, and lung tissues ex vivo at 4 weeks. (E) Number of lung nodules in mice in each treatment group. (F) Representative photographs of lung tissues of mice in each group and representative HE-stained images of lung tissues. (G) Changes in body weight of mice in each treatment group. All data are expressed as mean ± standard deviation (n=5). *p<0.05, **p<0.01.