Figures & data
Scheme 1 Schematic illustration of synthesis, radiosensitizing effects and antitumor therapy of Alb-GNPs.
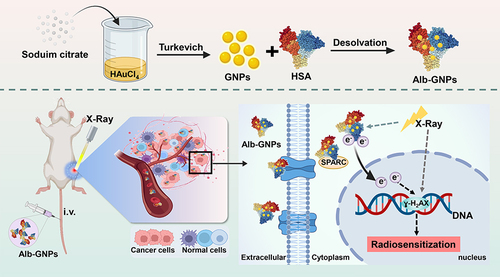
Table 1 Characterization of Nanoparticles
Figure 1 Characterization of GNPs, Alb-NPs and Alb-GNPs in vitro. (A) Aqueous solution of GNPs (left), Alb-NPs (middle) and Alb-GNPs (right), respectively. (B) The wavelength of GNPs, Alb-NPs and Alb-GNPs, respectively. (C) TEM images of GNPs. (D) TEM images of Alb-GNPs.
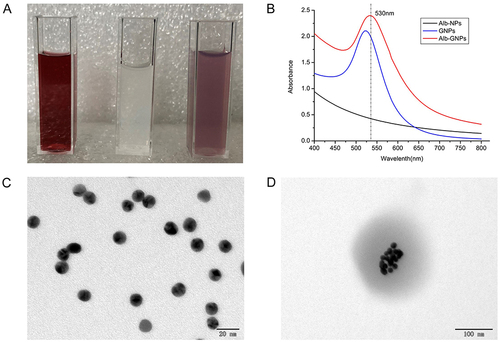
Figure 2 Cytotoxicity assessment and fluorescent images of cell uptake experiments in vitro. (A) Cell viability under different concentration of Alb-GNPs for 24 h. (B) Cell viability under different concentrations of Alb-GNPs combined with different dose of 6MV X-ray. (C) Fluorescent images of A549 cells treated with different concentrations of Alb-GNPs for 24 h, bar=20 μm.
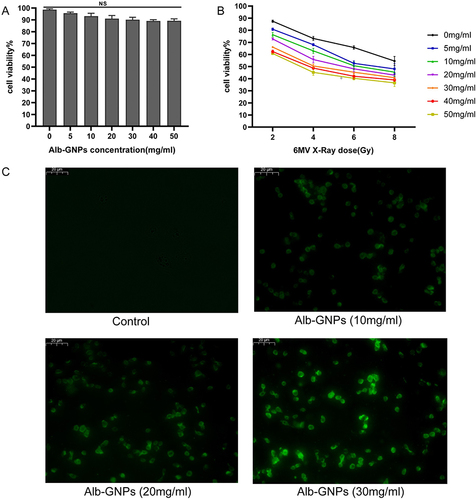
Figure 3 Clonogenic formation experiments in vitro. (A) Colony formation in X-ray (6 MV) and different concentrations (10, 20, 30 mg/mL) of Alb-GNPs combined with X-ray (6 MV). (B) Survival fraction of X-ray (6 MV) and different concentrations (10, 20, 30 mg/mL) of Alb-GNPs combined with X-ray (6 MV).
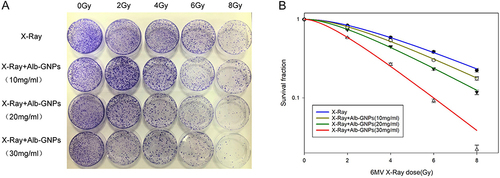
Figure 4 Apoptosis analysis and cell cycle distribution of A549 cells in each group in vitro. (A) The rate of cell apoptosis of different treatment groups, *p<0.05. (B) Cell cycle distribution of A549 cells for different treatment groups (P<0.05 in all cases).
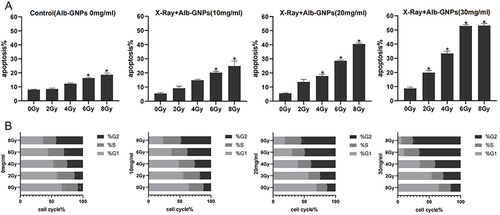
Figure 5 Evaluation of antitumor efficiency in vivo and body distribution. (A) General view of tumor tissue with different treatments; (B) tumor growth curves for the different experimental groups (*p<0.05, **p<0.01). (C) Body weight changes of mice during the period of the experiment. (D) The survival rate of each group. (E) The Au concentration in tumor, liver, spleen, kidney, and lung tissue of different groups.
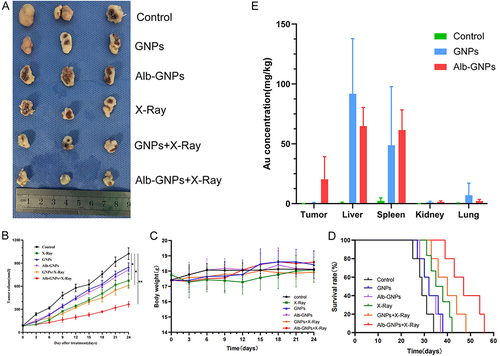
Figure 6 Immunohistochemical analysis of tumors. (A) Representative images of IHC of each group for the evaluation of γ-H2AX, Ki-67, and TUNEL (magnification ×400). (B) Quantitative analysis of γ-H2AX in tumors from mice in each group. (C) Quantitative analysis of Ki-67 in tumors from mice in each group. (D) Quantitative analysis of TUNEL in tumors from mice in each group (*p<0.05, **p<0.01). Alb-GNPs + X-ray group resulted in a significantly increase in the expression of γ-H2AX and TUNEL, while a decrease in Ki-67.
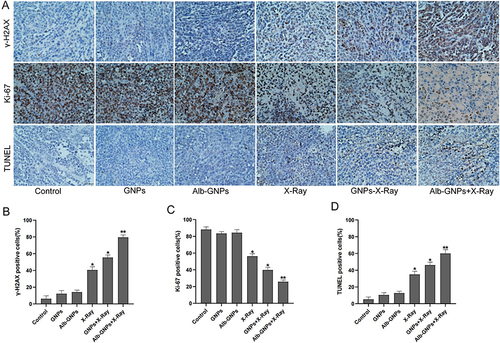
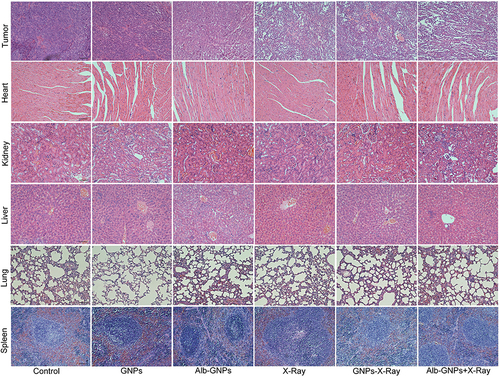
Figure 7 H&E staining of tumor tissues and vital organs in each group (magnification, ×200).