Figures & data
Figure 1 Characterization of different nanocomposite hydrogels. (A) The overall appearance of various hydrogels. (B) SEM images of different hydrogels. Scale bar=300μm (upper panel) and 10μm (lower panel). (C) FTIR spectra of GO, nHAP. (D) FTIR spectra of Alg, Alg/GO, Ser, Alg/GO/Ser, Alg/GO/Ser/nHAP, Alg/GO/nHAP. (E) Stress−strain curves of various hydrogels. (F) The storage modulus (G’) and loss modulus (G”) values of the fabricated hydrogels. (G) The swelling rate of different hydrogels. (H) Degradation profiles of different hydrogels.
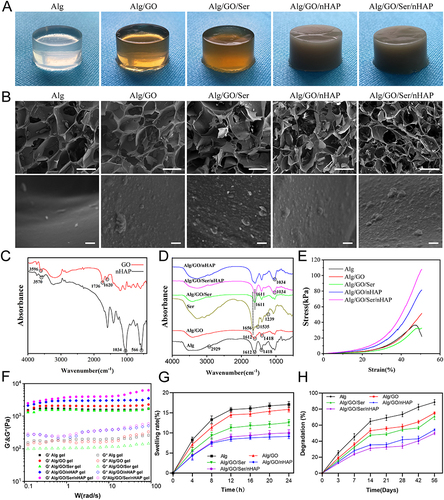
Figure 2 Biocompatibility properties of hydrogels. (A) The proliferation of BMSCs cultivated on various hydrogels for 1, 3, and 7 days. (B) The viability of BMSCs cultured with various hydrogels for 3 days was assessed by the live/dead staining. (C) The attachment of BMSCs seeded on the corresponding hydrogel after 1 and 4 days was exhibited in immunofluorescence images. Nuclei, blue; Cytoskeleton red. (***p < 0.001).
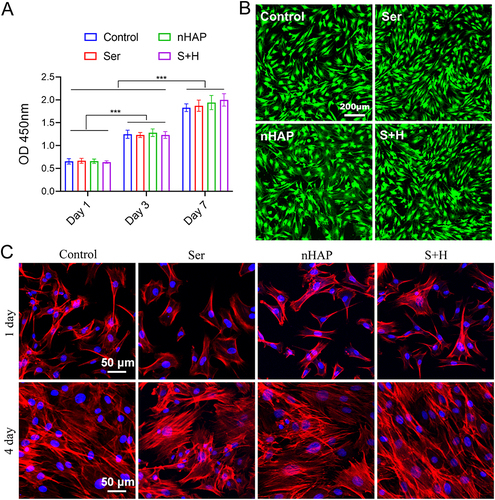
Figure 3 Effects of various hydrogels on regulating macrophage polarization. The macrophage was pre-cultured with LPS for 24 hours to induce M1 polarization and then incubated with the corresponding hydrogels for another 24 h. (A) iNOS and (B) Arg-1 IF staining of macrophages. Nuclei, blue; iNOS and Arg-1, red. (C) Quantitative analysis of IF for iNOS (left) and Arg-1 (right). (D) WB of the expression of Arg-1 and iNOS proteins. (E) Quantitative analysis of WB for Arg-1 (left) and iNOS (right). (F) The expressions of pro-inflammatory genes iNOS, TNF-α, and anti-inflammatory genes Arg-1, IL-10 were analyzed by RT-qPCR. (**p < 0.01, ***p < 0.001).
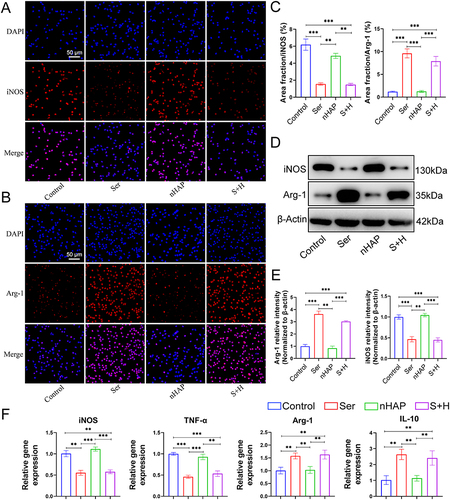
Figure 4 Osteogenesis of BMSCs induced by various hydrogels. (A) ALP staining after BMSCs treated with different hydrogels for 7 days. (B) ARS staining after BMSCs treated with different hydrogels for 21 days. (C) Normalized ALP activity (left) and semi-quantitative analysis of ARS staining (right). The IF for (D) OPN and (E) RunX2 of BMSCs after being treated with different hydrogels for 7 days. Nuclei, blue; OPN and RunX2, red. (F) Quantitative analysis of IF for OPN (left) and RunX2 (right). (G) WB of the expression of RunX2 and OPN protein for BMSCs cultured with scaffolds for 7 days. (H) Quantitative analysis of WB for OPN (left) and RunX2 (right). (I) RT-qPCR results of the gene expression related to osteogenesis (RunX2, OPN, OCN, and COLI) of BMSCs treated with different hydrogels for 7 days. (*p<0.05, **p<0.01, ***p <0.001).
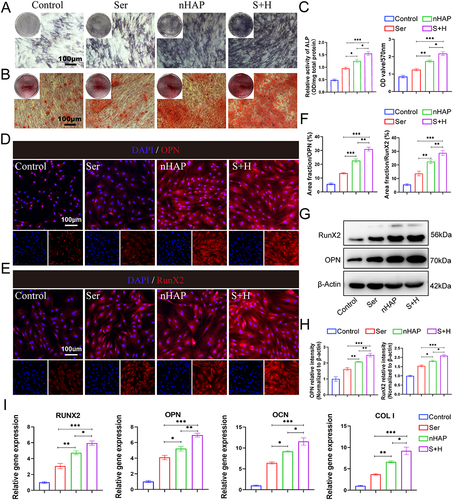
Figure 5 The influence of macrophage polarization on osteogenesis in BMSCs. (A) The illustration of experiment design. (B) ALP staining of BMSCs after induced using MCM for 7 days. (C) ARS staining of BMSCs after induced using MCM for 21 days. (D) Quantitative analysis of ALP activity (left) and ARS staining (right). The IF staining of (E) OPN and (F) RunX2 for BMSCs after induced using MCM for 7 days. Nuclei, blue; RunX2 and OPN, red. (G) Quantitative analysis of IF for OPN (left) and RunX2 (right). (H) WB detected Runx2 and OPN proteins in BMSCs after induced using MCM for 7 days. (I) Quantitative analysis of WB for OPN (left) and RunX2 (right). (J) RT-qPCR results of the gene expression related to osteogenesis (RunX2, OPN, OCN, and COLI) of BMSCs treated with different MCM for 7 days. (*p<0.05, **<p<0.01, ***p<0.001).
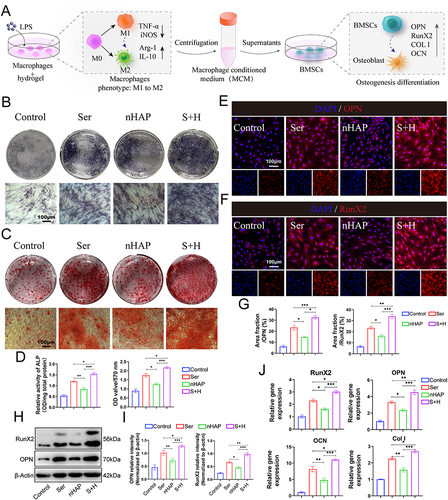
Figure 6 New bone regeneration property of different hydrogels in vivo. (A) After eight weeks of implantation, micro-CT pictures of cranial defects transplanted with various hydrogels or left unfilled were shown. (B) Quantitative analysis of BV/TV after implantation for 8 weeks. (C) Representative pictures of H&E staining after implantation for 8 weeks. (Scale bar: up=500μm, down=100μm). (D) Representative pictures of Masson staining after implantation for 8 weeks. (Scale bar: up=500μm, down=100μm). (OB, NB, FT, and HS symbolize original bone, new bone, fibrous tissue, and hydrogel scaffold, respectively). (*p<0.05, **p<0.01, ***p <0.001).
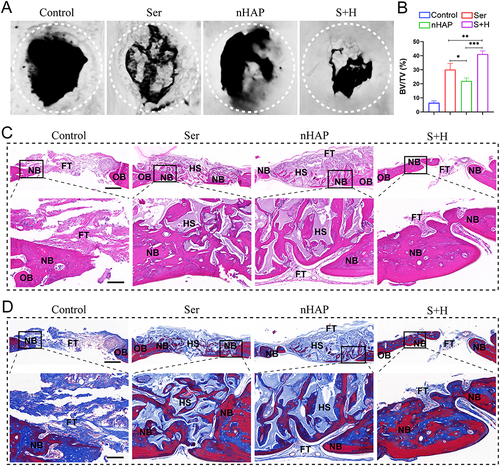
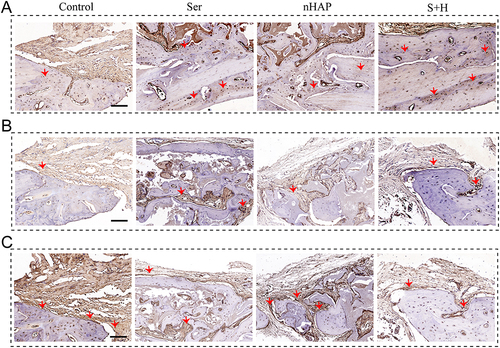
Figure 7 Immunohistochemical staining of COLI, Arg-1, and iNOS after implantation for 8 weeks. (A–C) Representative photographs of immunohistochemical staining of (A) COLI, (B) Arg-1, and (C) iNOS. Scale bar = 100μm. Red arrows represent relatively typical protein staining areas.