Figures & data
Figure 1 The chemical structure of Ziyuglycoside I its interaction with mTOR.
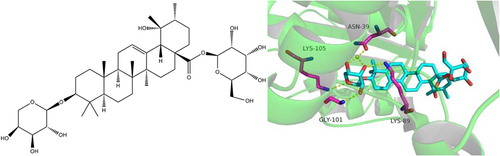
Figure 2 Preparation scheme of ZgI-AuNPs.
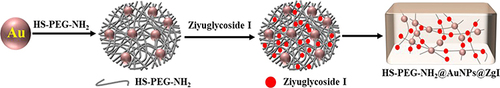
Figure 3 The preparation and characterization of ZgI-AuNPs. (A) The brief illustration of ZgI-AuNPs preparation. (B) Size distribution of AuNPs and ZgI-AuNPs. (C) Absorbance spectra of AuNPs and ZgI-AuNPs. (D) TEM image. (E) SEM image.
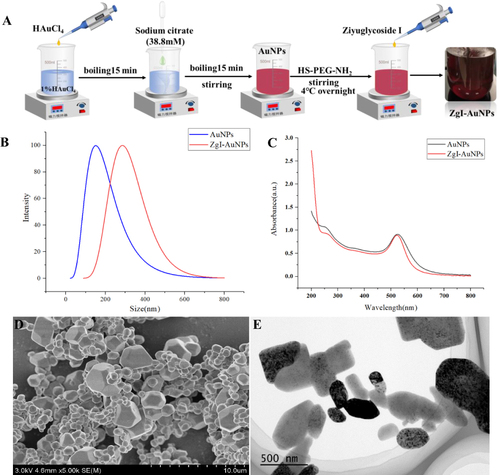
Figure 4 The FTIR spectrum. (a) Physical mixture. (b) ZgI-AuNPs. (c) ZgI. (d) AuNPs.
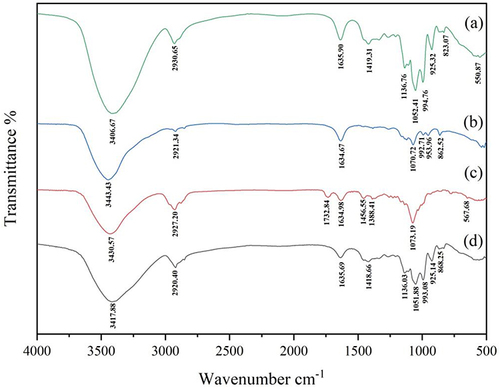
Figure 5 The DSC thermogram. (a) Physical mixture. (b) ZgI-AuNPs. (c) ZgI. (d) AuNPs.
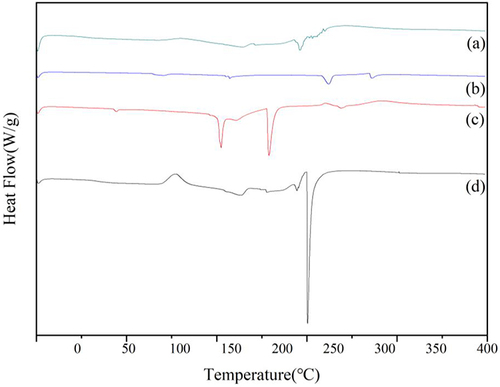
Figure 6 The XRD spectrum. (a) Physical mixture. (b) ZgI-AuNPs. (c) ZgI. (d) AuNPs.
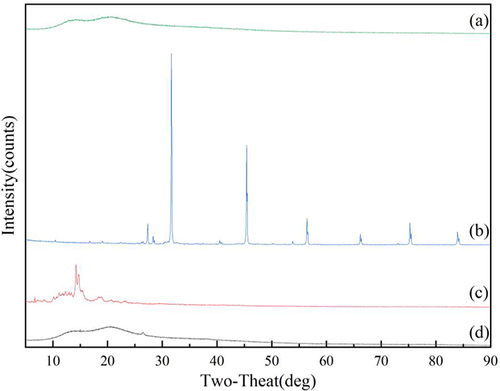
Table 1 The DL and EE of ZgI-AuNPss (n=3, mean±SD)
Figure 7 The test result of cumulative ZgI release. Data are presented as mean ± SD from three independent experiments.
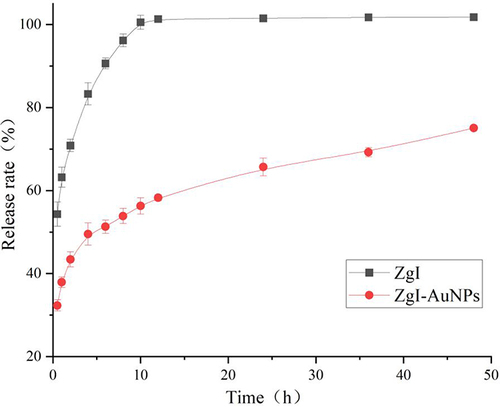
Figure 8 The effect of ZgI-AuNPs on survival rate of HSCS. (A). The cytotoxicity of CTX in normal HSPC-1 cells (n = 3, Mean ± SD). (vs Normal, *P<0.05, **P<0.05). (B). The viability of HSPC-1 cells.
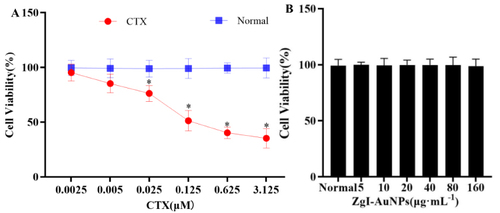
Figure 9 The effect of ZgI-AuNPs on the autophagy of HSCS cells. The red labeling of “N” represents the cell nuclear, the “Mi” represents the mitochondria and the “RER” represents the rough endoplasmic reticulum. The yellow arrows represents the autophagosomes. (A).Normal group: saline + RPMI 1640. (B). Model group: CTX + RPMI 1640. (C). AuNPs group: CTX + AuNPs. (D). ZgI group: CTX + ZgI. (E). ZgI-AuNPs group: CTX +ZgI- AuNPs.
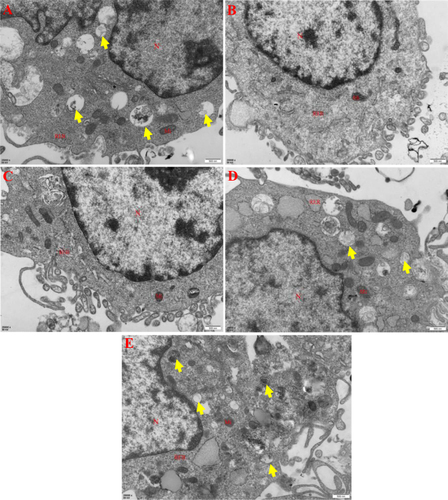
Figure 10 The effect of ZgI-AuNPs on the expression of LC3B in HSCS cells. (A).The mean of relative fluorescence density. (B)The green fluorescence of LC3B photographed by fluorescence microscope. Normal group: saline + RPMI 1640. Model group: CTX + RPMI 1640. AuNPs group: CTX + AuNPs. ZgI group: CTX + ZgI. ZgI-AuNPs group: CTX +ZgI- AuNPs. Data are presented as mean ± SD from six independent experiments (vs model group, *P<0.05, **P<0.05; vs AuNPs, ΔP < 0.05, ΔΔP < 0.01; vs ZgI, ★P < 0.05, ★★P < 0.01.).
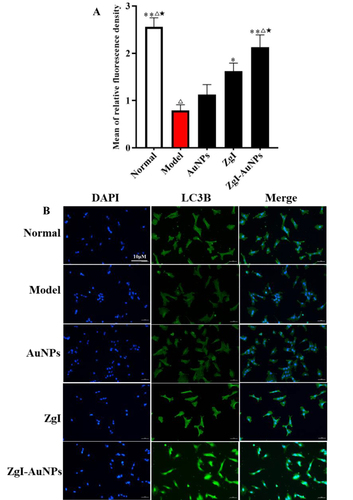
Figure 11 The effect of ZgI-AuNPs on the autophagy of mice HSCs cells. (A).NC group: saline. (B). CTX group:CTX + saline. (C). CLQ group: CLQ + saline. (D). CTX+CLQ group: CTX + CLQ + saline. (E). ZgI group: ZgI + CTX + CLQ + saline. (F).ZgI-AuNPs group: ZgI-AuNPs + CTX + CLQ + saline. The yellow arrows represents the autophagosomes.
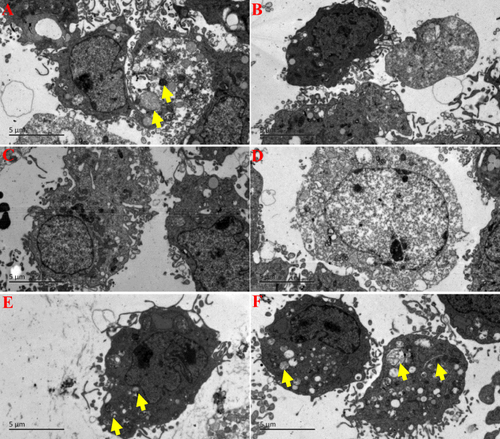
Figure 12 The immunohistochemical detection of P62 protein in haematopoietic stem cells. (A) The immunohistochemical images of P62 protein. (B) The statistical chart of P62 protein-positive cells. (a).NC group: saline. (b). CTX group:CTX + saline. (c). CLQ group: CLQ + saline. (d). CTX+CLQ group: CTX + CLQ + saline. (e). ZgI group: ZgI + CTX + CLQ + saline. (f).ZgI-AuNPs group: ZgI-AuNPs + CTX + CLQ + saline. Data are presented as mean ± SD from six independent experiments (vs CTX+CLQ group group, *P<0.05, **P<0.05; vs ZgI, ΔΔP < 0.01).
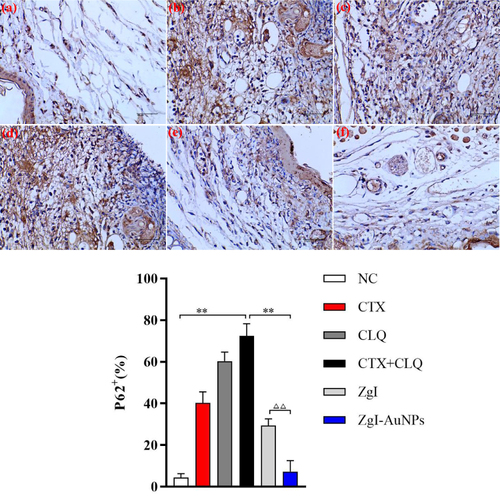
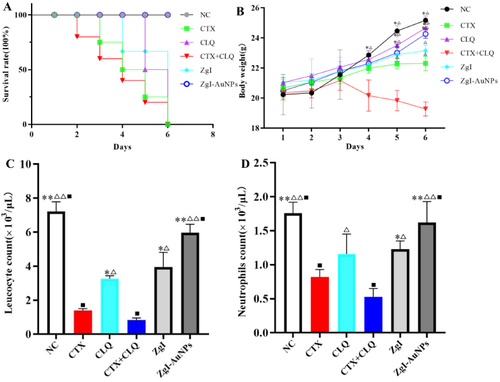
Figure 13 The effect of ZgI-AuNPs on the blood cell production capacity of mice HSCs. (A).The survival rate of each group. (B)The body weight change of each group (n = 6, Means ± SD), (vs CTX group, *P<0.05, **P<0.05; vs CTX+CLQ group, ΔP < 0.05, ΔΔP < 0.01). (C).The leukocytes count of each group (n = 6, Means ± SD), (vs CTX group, *P<0.05, **P<0.05; vs CTX+CLQ group, ΔP < 0.05, ΔΔP < 0.01; vs ZgI group, ■P < 0.05). (D) The neutrophils count of each group(n = 6, Means ± SD), (vs CTX group, *P<0.05, **P<0.05; vs CTX+CLQ group, ΔP < 0.05, ΔΔP < 0.01; vs ZgI group, ■P < 0.05). NC group: saline. CTX group:CTX + saline. CLQ group: CLQ + saline. CTX+CLQ group: CTX + CLQ + saline. ZgI group: ZgI + CTX + CLQ + saline. ZgI-AuNPs group: ZgI-AuNPs + CTX + CLQ + saline.