Figures & data
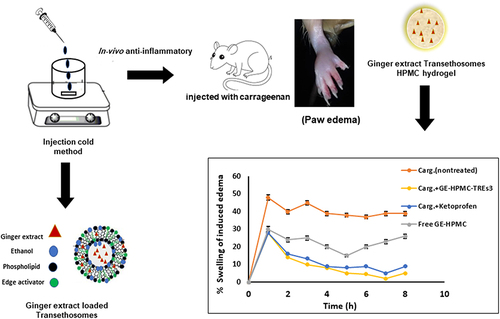
Table 1 Composition of ginger extract (GE) transethosome (TRE) nanovesicles per 10 mL colloidal dispersion, and composition of GE transethosomal and nontransethosomal hydrogel formulations
Table 2 Characterization of ginger extract (GE)-loaded transethosome (TRE) nanovesicles. Data presented as means ± SD (n=3)
Figure 1 (A) Transmission electron microscopy and (B) size distribution of GE-loaded transethosomes prepared using sodium deoxycholate. Magnification 72,000×, scale bar 100 nm.
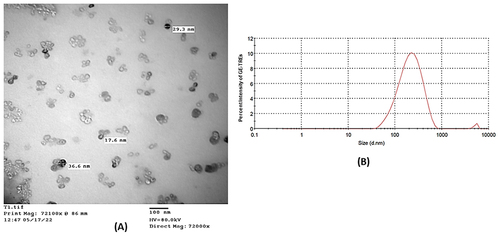
Figure 2 FT-IR spectra of (A) pure ginger extract, (B) blank transethosomes, and (C) ginger-extract transethosomes prepared using sodium deoxycholate (TRE3).
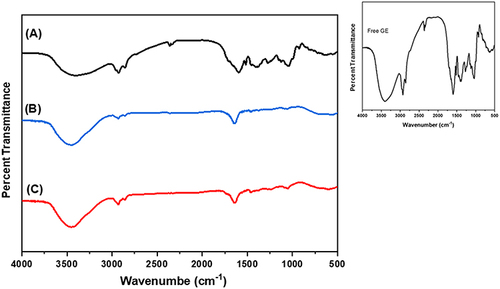
Table 3 Physical appearance, mean vesicle size, polydispersity index (PDI) and entrapment efficiency (EE) of GE-loaded TREs after 1-month storage at 4°C and 25°C. Data presented as means ± SD (n=3)
Table 4 Characterization of ginger extract transethosomal and nontransethosomal hydrogel formulations. Results presented as a means ± SD (n=3)
Figure 3 Rheological profiles of GE transethosomal and nontransethosomal hydrogel formulations at 25°C (n=3).
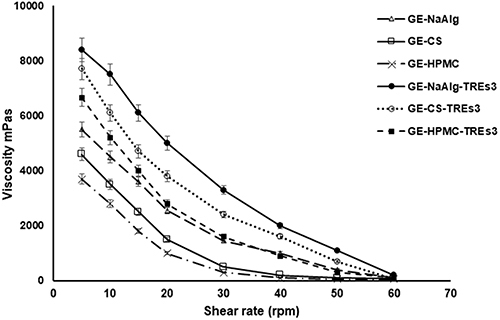
Figure 4 (A) Cumulative in vitro release profiles of GE from NaAlg hydrogel (F1), CS hydrogel (F2), HPMC hydrogel (F3), and GE aqueous solution in phosphate buffer (pH 6.8 for 24 h at 37°C). Data presented as means ± SD (n=3). (B) Cumulative in vitro release profiles of GE from NaAlg TRE3 hydrogel (F4), CS-TRE3 hydrogel (F5), HPMC-TRE3 hydrogel (F6), and GE-TRE3 suspension in phosphate buffer (pH 6.8 for 24 h at 37°C). Data presented as means ± SD (n=3).
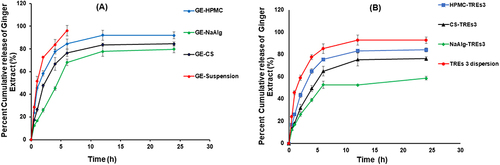
Figure 5 Cumulative in vitro release profiles of GE from TRES3 dispersion, HPMC hydrogel (F3), and HPMC-TRE3 hydrogel (F6) in phosphate buffer (pH 7.4 for 24 h at 37°C). Data presented as means ± SD (n=3).
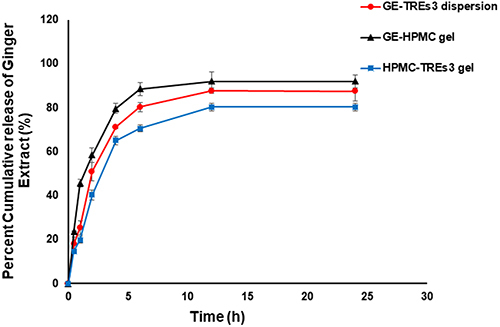
Figure 6 Ex vivo permeation profiles (A) and skin-deposition percentages (B) of ginger extract HPMC hydrogel (F3) and HPMC-TRE3 hydrogel (F6) in comparison with drug solution in phosphate buffer (pH 7.4 for 24 h at 37°C). Data presented as means ± SD (n=3).
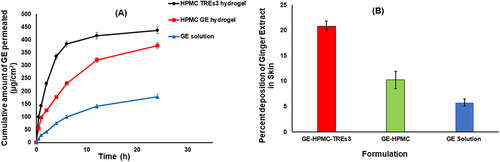
Table 5 Physicochemical evaluation of ginger extract transethosome hydrogel (HPMC-TRE3 gel; F6) during the stability study (means ± SD, n=3)
Figure 7 Percentage swelling (A) and inhibition of induced paw edema (B) in rats after treatment with free ginger-extract HPMC hydrogel (F3), transethosomal HPMC hydrogel (F6), and commercial gel (ketoprofen, 1%) compared with unmedicated group (carrageenan-induced paw edema). *Significantly different from free ginger-extract HPMC hydrogel (GE-HPMC) at P<0.05. Data presented as means ± SEM of five experimental rats per group.
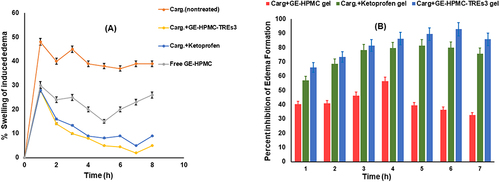
Figure 8 (A) Effect of GE-HPMC-TRE3 hydrogel and ketoprofen gel (1%) on serum TNFα level in paw tissue. Means ± standard errors of the mean (SEM). *P<0.05, carrageenan vs control group; #P<0.05, carrageenan + GE-HPM-TREs and carrageenan ketoprofen group vs carrageenan group. (B) Effect of GE-HPMC-TRE3 hydrogel and ketoprofen gel (1%) on serum PGE2 level in paw tissue. Data presented as means ± SEM. *P<0.05, carrageenan vs control group; #P<0.05, carrageenan + GE-HPM-TREs and carrageenan + ketoprofen group vs carrageenan group.
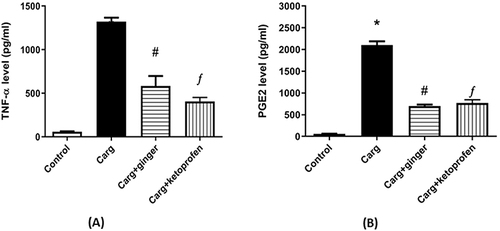
Figure 9 (A) ROS production in paw tissue in carrageenan-induced edema group was increased in compared with the control rats. GE-HPMC-TRE hydrogel and ketoprofen gel produced a significant decrease in ROS production compared to the control. (B) Paw-tissue homogenates of carrageenan-treated group showed a significant increase in MDA, and treatment with GE-HPMC-TRE hydrogel and ketoprofen gel inhibited this effect.
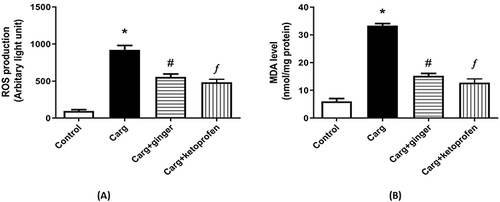
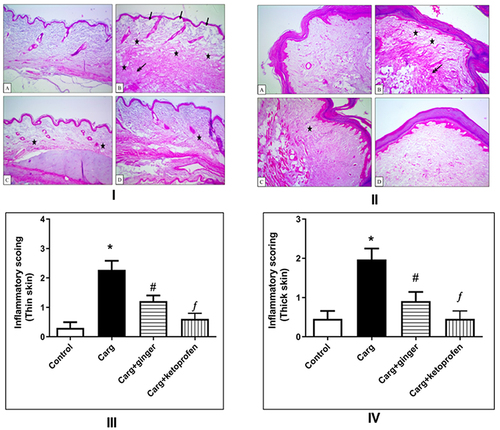
Figure 10 I and II: Histological examination (H&E, 100×) of rat-paw skin. Histological examination of paw skin in rat model of carrageenan-induced paw edema using H&E staining. (I) Thin-skin photomicrographs; (II) thick-skin photomicrographs:. IA and IIA: Control sections with normal histological structure in both thin and thick skin. IB and IIB: Sections obtained from positive control (carrageenan-induced edema without treatment) with detachment of epidermal layer (arrow), severe vacuolation, and edematous reaction in thin and thick skin (stars) and severe dermal inflammatory reaction in thin skin (double-headed arrow), as well as severe inflammatory reaction in dermal and muscular layers in thick skin (double-head arrow). IC and IIC: Sections obtained from animals treated with GE-HPMC-TRE3 hydrogel showed moderate dermal edematous and inflammatory reactions (stars). ID and IID: Sections obtained from animals pretreated with ketoprofen gel showed mild dermal edematous and inflammatory reaction (star). III and IV: Results of statistical analysis of inflammation scores of experimental groups for thin and thick skin.