Figures & data
Table 1 Optimization of Nio-TH Using Box–Behnken Method
Figure 1 (A–C) Box–Behnken method for size (A), PDI (B), and EE (C) as a function of the lipid content and molar ratio of Vitamin (E) Span 60; (D–G) The optimized responses obtained by Box–Behnken design method under the optimum conditions: (D) Vesicle size, (E) PDI, (F) EE (%), and (G) Zeta potential. Data are represented as mean ± SD and n=3; ***p<0.001, **p<0.01, *p<0.05.
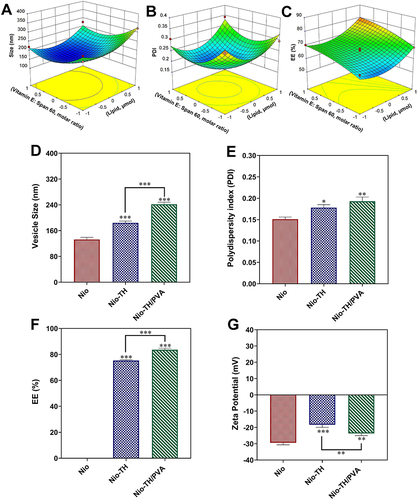
Table 2 ANOVA Statistical Analysis for the Quadratic Polynomial Model for Particle Size, PDI, and Entrapment Efficiency
Table 3 Predicted Models of Nio-TH
Table 4 Summary of the Results of Regression Analysis for the Various Parameters (Size, PDI, and Entrapment Efficiency) Employed for Fitting to the Quadratic Model
Table 5 Desirability Criteria and Predicted Values for the Variables
Figure 2 (A) Particle size distribution of Vehicle (Nio/PVA), Nio-TH, and Nio-TH/PVA by Dynamic Light Scattering (DLS). (B and C) Morphological analysis by SEM; (B) optimum Nio-TH, (C) Nio-TH/PVA. (D and E) Morphological analysis by TEM. (D) optimum Nio-TH, (E) Nio-TH/PVA.
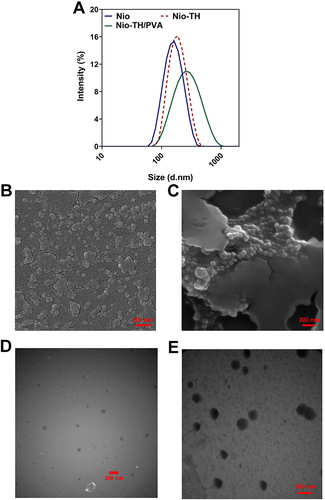
Figure 3 (A) In vitro release of TH from Nio-TH and Nio-TH/PVA at pH 7.4 and pH 5.4; (B and C) Size stability evaluation of Nio-TH (B), and Nio-TH/PVA (C); (D and E) PDI stability evaluation of Nio-TH (D), and Nio-TH/PVA (E); (F and G) EE (%) stability evaluation of Nio-TH (F), and Nio-TH/PVA (G) after two months of storage at 4 ± 2°C and 25 ± 2 °C. Data are represented as mean ± SD and n=3; ***P<0.001, **P<0.01, *P<0.05.
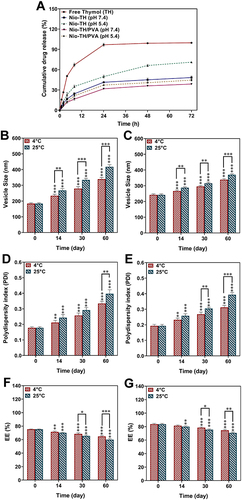
Table 6 The Kinetic Release Models and the Parameters Obtained for Optimum Niosomal Formulation
Table 7 IC50 Levels in the Three Cancerous Cell Lines Treated with TH, Nio-TH and Nio-TH/PVA. Data are Represented as Mean ± SD and n=3
Figure 4 Different concentrations of TH, Nio-TH, and Nio-TH/PVA (0, 10, 20, 40, 80 and 160 μg/mL) were added to the cultured MCF-7, AGS, HepG2 and HFF cells seeded onto 96-well (2×10⁵ cell/well) (A) The effect of different dilutions of Nio/PVA on cell viability in MCF-7, AGS, HepG2 and HFF cell lines. (B) Cytotoxicity evaluation of TH, Nio-TH and Nio-TH/PVA on HFF cell line. The impact of TH, Nio-TH, and Nio-TH/PVA on cell viability in (C) MCF-7, (D) AGS, (E) HepG2 cancerous cell lines. (F) Bar plot and (G) Heat-map of the IC50 levels in the three cancerous cell lines treated with nanodrug samples. Data are represented as mean ± SD and n=3; The p-values are *p < 0.05, **p < 0.01, ***p < 0.001.
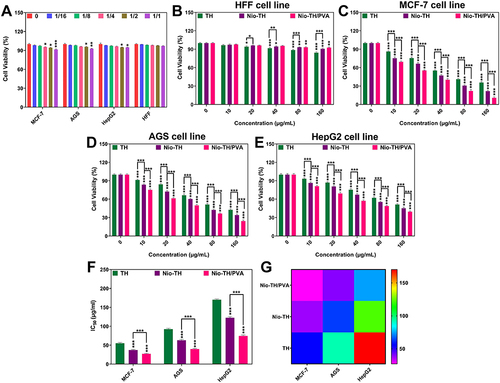
Figure 5 MCF-7, AGS, and HepG2 cancer cells (1×10⁸ cells/well in 96-well plate) were treated with IC50 concentration of Vehicle, TH, Nio-TH, and Nio-TH/PVA. The expression levels and its heat-map for Caspase-3 (A and B), Caspase-9 (C and D), MMP-2 (E and F), MMP-9 (G and H), CyclinD (I and J), CyclinE (K and L) genes in MCF-7, AGS, and HepG2 cells after treatment with various samples. The IC50 was used for each sample. Data are represented as mean ± SD and n=3; ***p<0.001, **p<0.01, *p<0.05.
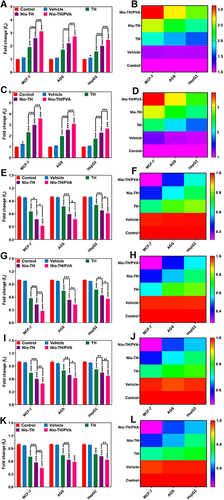
Figure 6 Flowcytometric analysis of all samples in (A) MCF-7, (B) AGS, and (C) HepG2 cell lines. Cell suspension was adjusted to 5×10⁵ cells/mL and were seeded onto 6-well and treated with IC50 concentration of various formulations. Analysis of the apoptosis rate in (D) MCF-7, (E) AGS, and (F) HepG2 cancer cell lines after incubation with different samples. Q1 (necrotic cells), Q2 (late apoptosis), Q3 (early apoptosis), and Q4 (alive cells). (G) Apoptosis rate in MCF-7, AGS, and HepG2 cell lines treated with all samples. (H) Heat-map of apoptosis analysis of all samples in MCF-7, AGS, and HepG2 cell lines. Data are represented as mean ± SD and n=3; ***p<0.001, **p<0.01, *p<0.05.
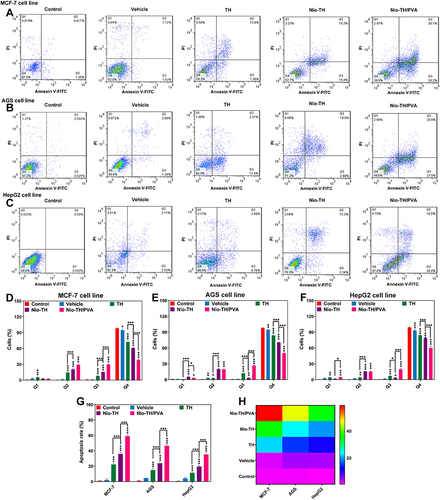
Figure 7 Cells were seeded at a density of 1×10⁶ cells per well in complete medium in 6-well plates All of these experiments were conducted using IC50 concentration. Histograms showing DNA content of cell cycle progression of all samples in (A) MCF-7, (B) AGS, and (C) HepG2 cell lines. Cell cycle distribution of (D) MCF-7, (E) AGS, (F), HepG2 cell lines treated with all samples. The SubG1 percentage in all the cancerous cell lines treated with all samples, shown as (G) A bar plot and (H) A heat-map. Data are represented as mean ± SD and n=3; ***p<0.001, **p<0.01, *p<0.05.
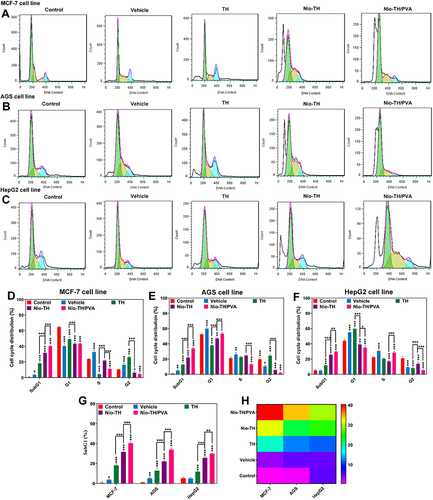
Figure 8 (A) Bar plot and (B) heat-map showing activity levels of Caspase-3 of all samples in MCF-7, AGS, and HepG2 cell lines that were treated with IC50 concentration. (C) Bar plot and (D) heat-map showing activity levels of Caspase-9 of all samples in MCF-7, AGS, and HepG2 cell lines. (E) Bar plot and (F) heat-map showing DCF fluorescence of all samples in MCF-7, AGS, and HepG2 cell lines. Data are represented as mean ± SD and n=3; ***p<0.001, **p<0.01, *p<0.05.
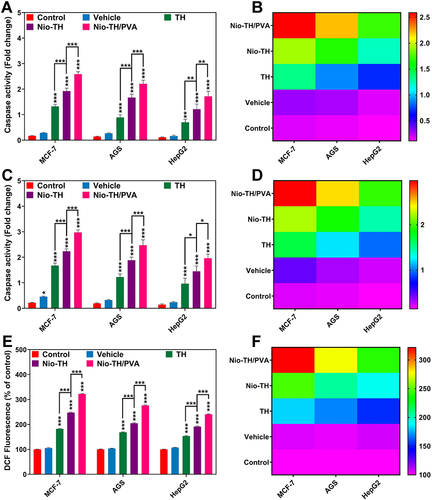
Figure 9 Qualitative Migration analysis of all samples in (A) MCF-7, (B) AGS, and (C) HepG2 cell lines exposed to IC50 concentration of vehicle, TH, Nio-TH, and Nio-TH/PVA. (D) Migration rate of the three cancerous cell lines in all samples presented as bar plots. (E) Heat-map of migration analysis of all samples in MCF-7, AGS, and HepG2 cell lines. Data are represented as mean ± SD and n=3; ***p<0.001.
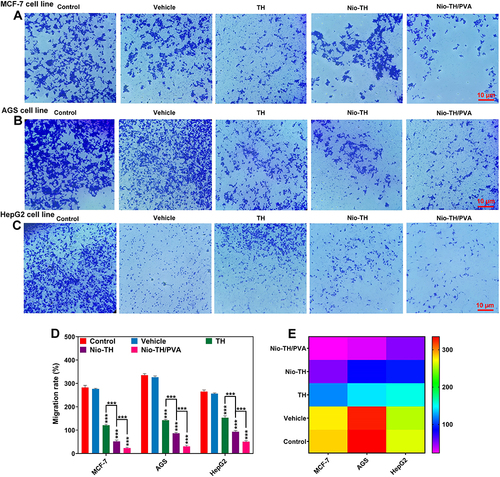
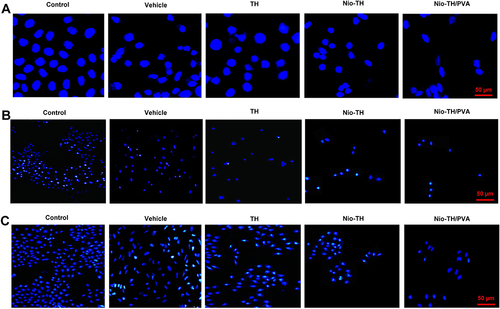
Figure 10 DAPI staining determining the number of nuclei of all samples in (A) MCF-7, (B) AGS, and (C) HepG2 cell lines. MCF-7, AGS, and HepG2 cells were plated onto a 24-well plate and exposed to the IC50 concentration of formulations for 48 hrs.