Figures & data
Figure 1 The synthetic route and function of the NPF@DOX nanocarriers. The release of DOX was accelerated in the low-pH microenvironment, and the amount of DOX released increased with temperature.
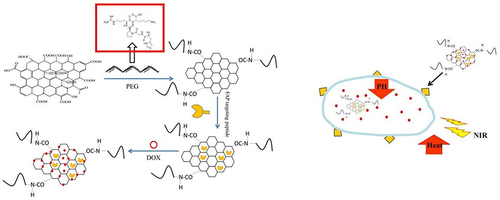
Figure 2 Nanocarrier preparation, characterization, and measurements of photothermal effects and stability. (A) TEM images of NGO, NP, NPF, and NPF@DOX nanocarriers. Scale bar: 200 µm. (B) Photothermic heating curves of NPF@DOX under 808 nm irradiation (1.0 W/cm2) followed by cooling to room temperature. (C) Photothermal properties of NPF@DOX throughout five cycles of laser irradiation at 808 nm (1.0 W/cm2). (D) Drug release curves of nanoparticles under pH 7.4 or 5.5 conditions with or without 808 nm NIR.
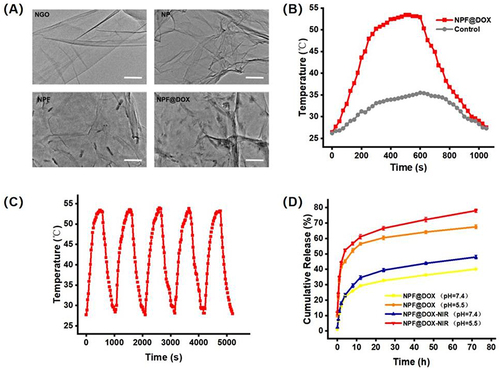
Figure 3 FAP is highly expressed in OSCC. (A) Representative immunohistochemistry images of FAP staining in normal and OSCC tissues. Scale bar: 100 µm. (B) Representative immunohistochemistry images of FAP staining in HOK and CAL-27 cells. Scale bar: 50 µm.
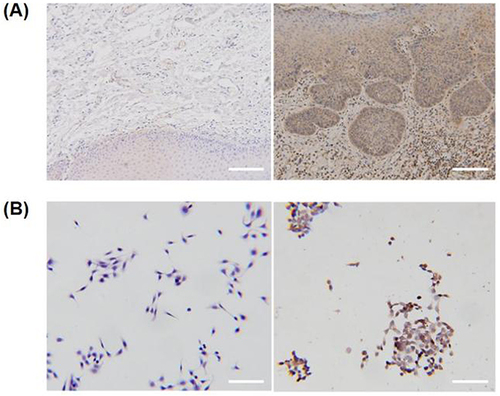
Figure 4 In vitro cellular uptake and drug release. CLSM images of CAL-27 cells treated with NP@DOX or NPF@DOX with or without 808 nm NIR irradiation (1.0 W/cm2) to evaluate cellular uptake. Scale bar: 20 µm.
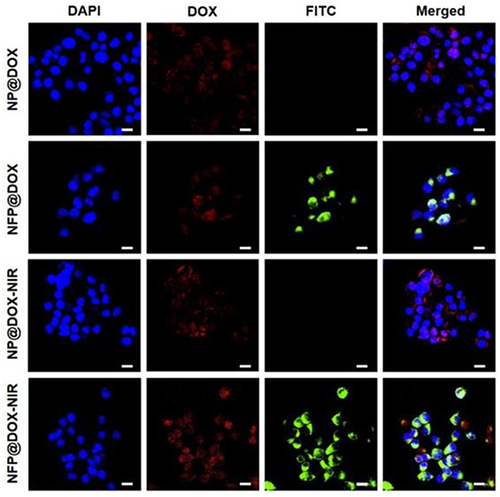
Figure 5 Cytotoxicity and in vitro combination therapy. (A) Viability of CAL-27 cells after treatment with control, NPF, NPF-NIR, NP@DOX, NPF@DOX, NP@DOX-NIR, and NPF@DOX-NIR. Data are presented as means ± SD, n=3 (***P<0.001). (B) CAL-27 cells stained with calcein AM (green) and propidium iodide (red) following various treatments were analyzed for live/dead status. Scale bar: 50 µm.
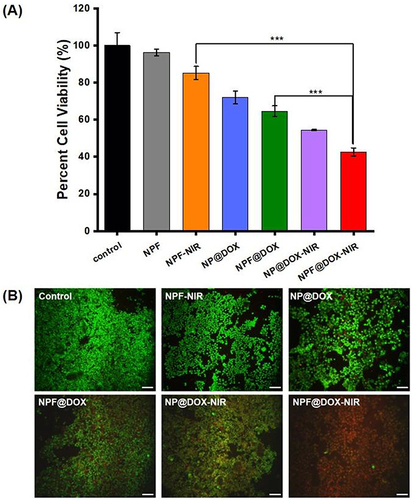
Figure 6 Tumor-specific infiltration using nanocarrier fluorescence. (A) In vivo imaging of CAL-27 tumor-bearing mice 1, 3, 6, 9, 12, and 24 h after intravenous injection of NPF-Cy5.5 or NS. (B) Ex vivo fluorescence images of NPF in the tumors and major organs/tissues after intravenous injection.
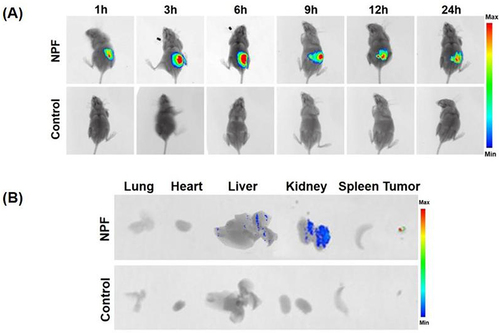
Figure 7 Continued.
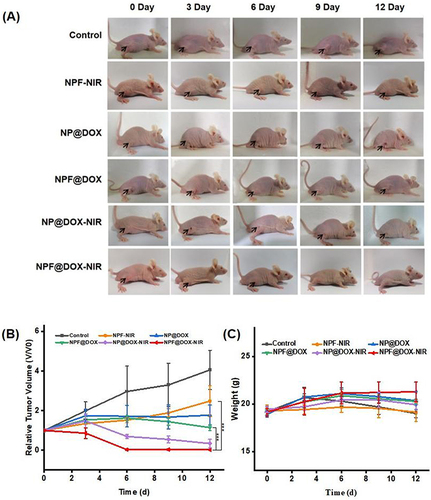
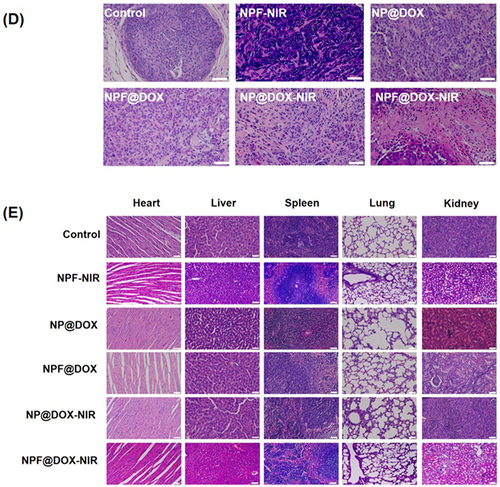
Figure 7 In vivo antitumor efficacy of NPF@DOX in BALB/c mice and biosafety analysis. (A) Representative images of tumor-bearing mice taken 12 d post-treatment. The arrows in the images points to the location of the tumor. (B) Tumor volume growth after various treatments. Data are presented as means ± SD, n=3 (***P<0.001) (C) Body weight comparisons of mice following intravenous administration of different treatments in tumor-bearing BALB/c nude mice (mean ± SD) with 3 mice in each group. (D) H&E staining images of excised tumors at the end of treatment. Scale bar: 50 µm. (E) H&E staining images of hearts, livers, spleens, lungs, and kidneys of mice in each group after tail vein injection of nanocarriers. Scale bar: 50 μm.